

With the advent of streamlined Raspberry Pi + NMEA 2000 hardware, building a dedicated Signal K server has never been easier. Signal K is very powerful, but most people I talk to want to go a step further and have Grafana graphs and dashboards, along with other plugins and features. This article goes through my recommended steps to set up the base operating system and common programs for those items.
Prerequisites
This is a moderately technical article. You need to have some skills with computers to be able to download software, issue terminal commands, and understand the general parts of what I'm doing below. Most all commands require sudo privileges as well, which if you are using the default “pi” user isn't an issue. If you're doing it on some other system, you will have to check your permissions.
I will be using a Mac for all of my steps. If you're using another operating system, you'll have to adapt some of these steps.
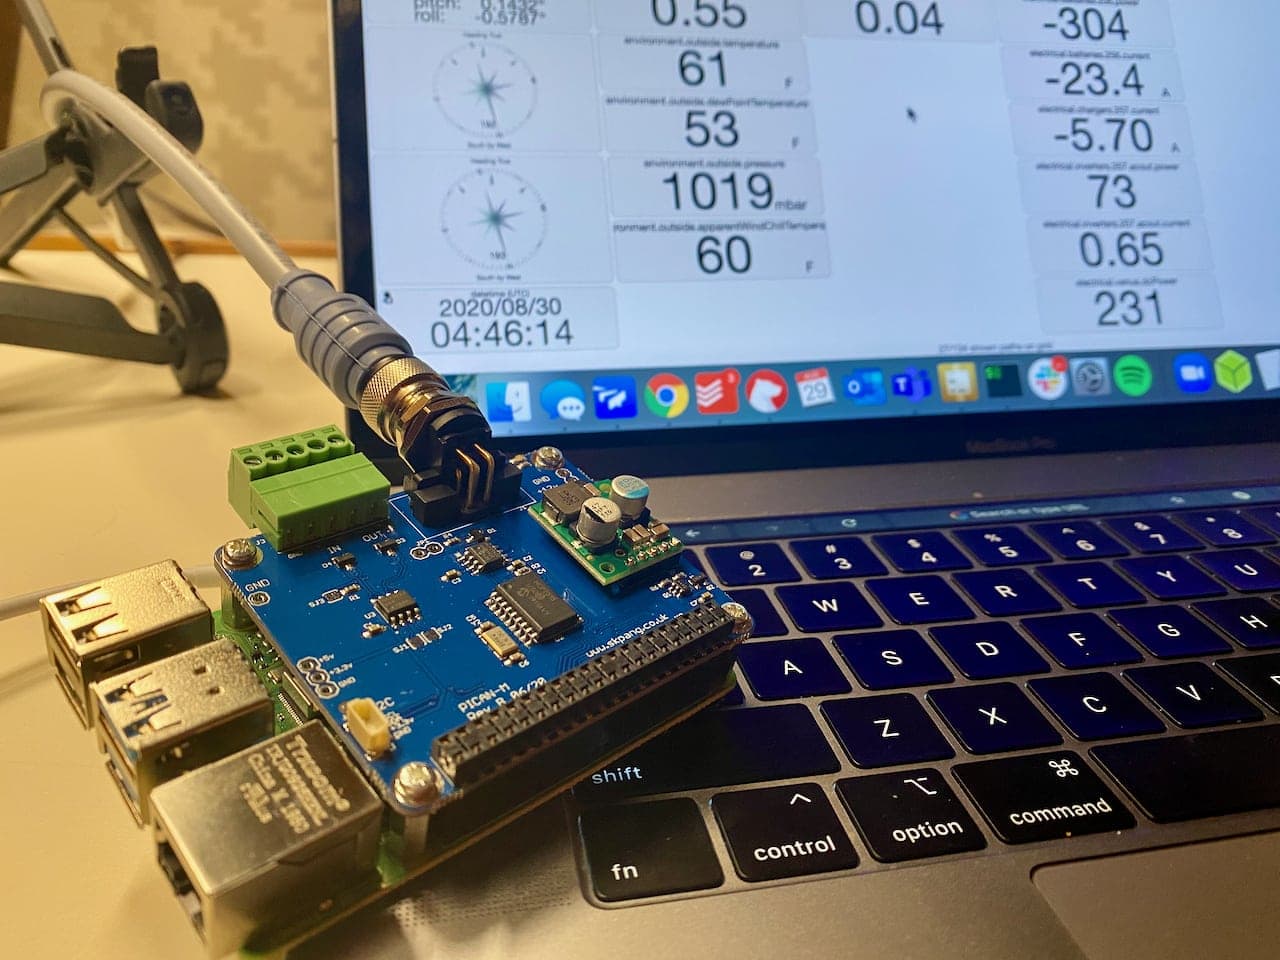
I will be using a Raspberry Pi 4 with the PICAN-M add-on board that I discuss in the article below.
I will be installing various Signal K plugins I consider to be essential to effectively use the server, and those related to Grafana and InfluxDB.
We'll also be installing Grafana and Influx and creating a test dashboard and graph.
This creates a powerful computer that will plug directly in to your NMEA 2000 network where it will get power and essentially be self sufficient.
Some people have asked me why I don't use OpenPlotter for this, and the simple reason is performance. While having one Raspberry Pi running charts, navigation and all of this would be great, I've never seen it work reliably on a boat with any decent amount of NMEA 2000 traffic. Raspberry Pi's are great computers for the money, but they can't compete against a proper laptop, PC, or even an MFD when it comes to doing lots of things at once. This very configuration below runs my Raspberry Pi at a load average of 0.35 consistently while I am at anchor. Underway it is running near 0.75 and higher, which really doesn't leave any room for expansion.
I also prefer having specific things isolated – if I am using something to drive my autopilot, I don't want it to stop sending autopilot commands because it is busy logging or drawing graphs. For that reason, I don't use OpenPlotter to do graphing and other things, even though their latest versions include Signal K and you can use Grafana on them as well.
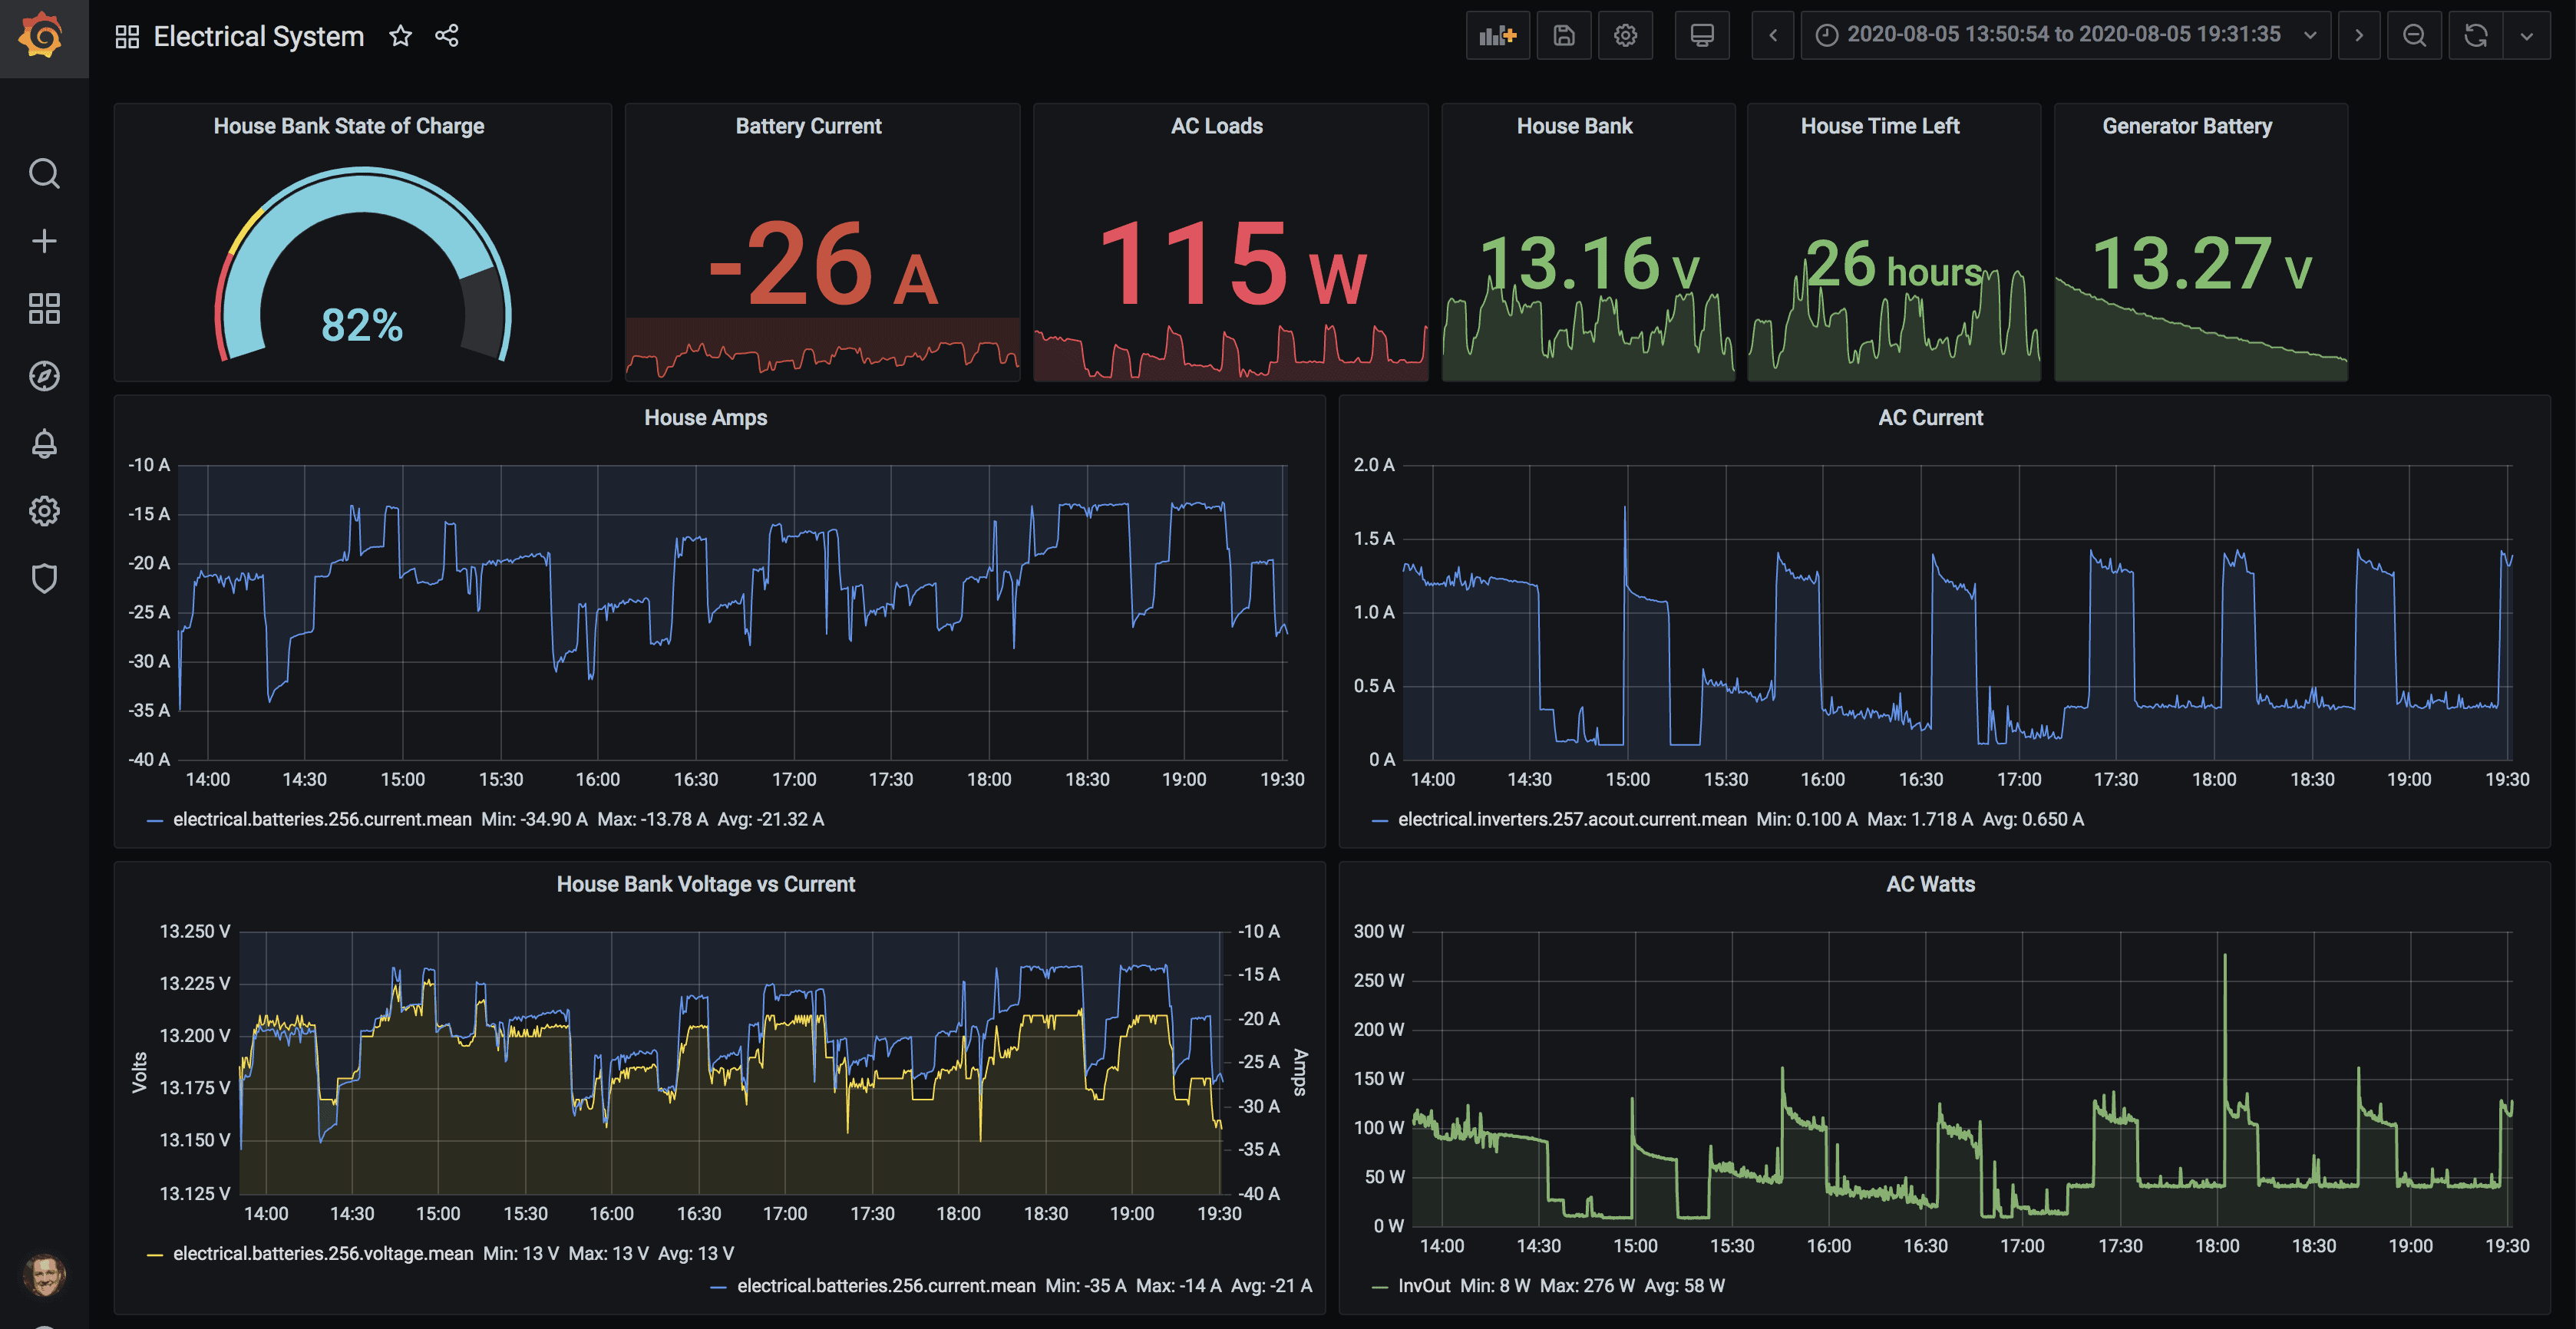
The ultimate goal is to have this hardware working with a stable operating system and related programs such as Signal K, InfluxDB, Telegraf and Grafana so that you can have a reliable node on your NMEA 2000 network gathering data, displaying dashboards, sending alerts and even more. The article below covers some of the dashboards that I use, and how I created them, and is one of the primary use-cases for my setup:
Installing the Operating System
I prefer not to use the provided version of the operating system usually shipped on standard Raspberry Pi kits. Instead, I use the Raspberry Pi OS Lite image which does not have all of the desktop components. This means it is much smaller, less software installed, and less overhead.
Less software means less updates and downloads to keep things current. That's a big consideration with limited LTE data plans. Not running all of the desktop stuff means less CPU usage as well.
The software image can be downloaded from the Raspberry Pi OS page and you can write it with an image tool, or you can download an imager that will take care of downloading and installing it all in one.
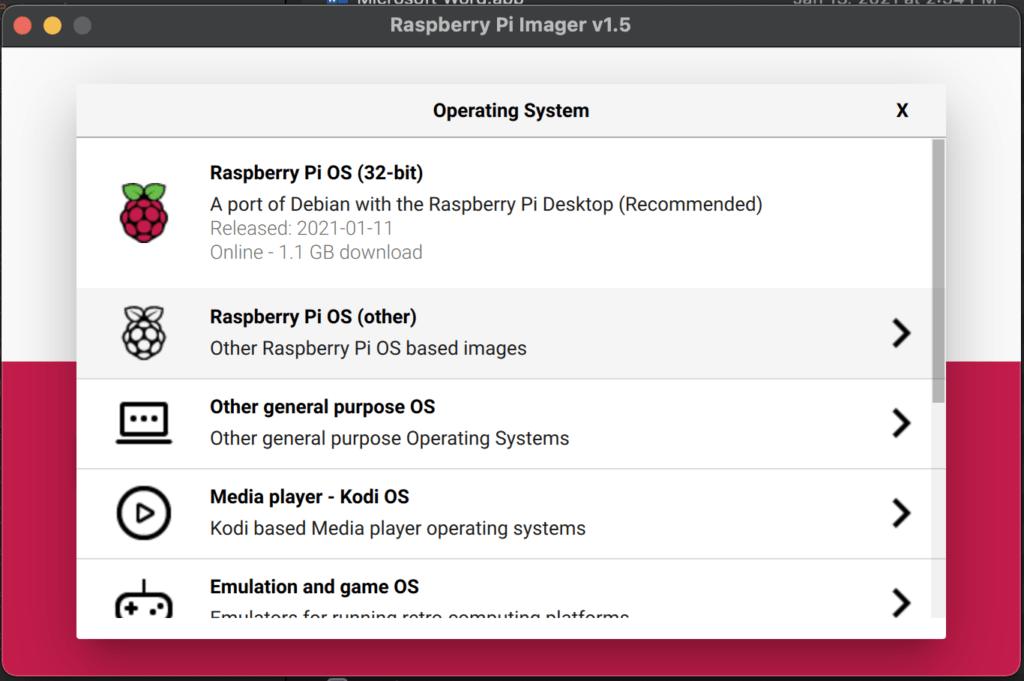
After downloading the imager, instead of using the defaults, choose “Raspberry Pi OS (other)”.
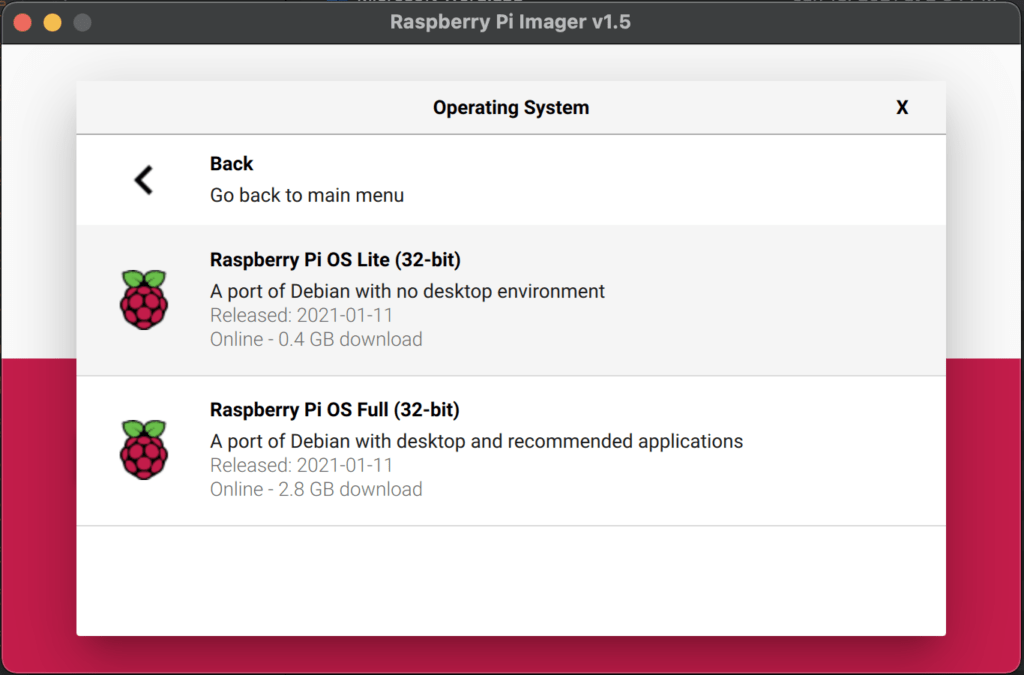
Choose “Raspberry Pi OS Lite” – you'll notice that it is quite a bit smaller – around 400 MB versus over 1GB for the standard image, or 2.8GB for the full OS.
Once you've chosen, pick your SD card, and start the write process. Once it is completed, leave it in the computer as you'll need to create some files in the Networking Setup part below.
Networking Setup
I prefer not to have to find a monitor, mouse and keyboard when setting up RPi, and use either the ethernet port or WiFi to get things connected. Ethernet is easy – just plug it in to your switch and apply power. The RPi will pick up an automatic address from your router (DHCP) and you can use that to access it and get started.
If you don't have a spare ethernet port, or if you set up a lot of these, like me, you can also pre-populate information on your newly created SD card so that the Pi joins your WiFi network on first boot.
You'll need to create a text file on the SD card in a particular directory with your WiFi network and password. You can read more detailed instructions on how to do this, but I've summarized what I do below:
Change to the SD card – with the current RPi installer, it seems to name the resulting image “boot”
cd /Volumes/bootEdit the file for the WiFi info
vi wpa_supplicant.confAdd this text to the file, changing the values to match your country code, WiFi network name, and password
ctrl_interface=DIR=/var/run/wpa_supplicant GROUP=netdev
update_config=1
country=<Insert 2 letter ISO 3166-1 country code here>

network={
 ssid="<Name of your wireless LAN>"
 psk="<Password for your wireless LAN>"
}
Save the file. This file will be read on startup and will connect to your WiFi network. Note that it can take up to 5 minutes before the install process completes, so be patient.
In addition to the WiFi networking, you'll need a way to access the Pi remotely, and I prefer SSH. It is secure, low bandwidth, and very reliable. You can read more about how to set this up here, but my short version is below.
You'll need to create a file in the same directory as the WiFi one above named “ssh”. I use the touch command. Nothing needs to be in the file.
touch sshThis will enable the SSH server on installation.
Put the SD card back into your Pi, provide it power either by USB connection or NMEA 2000 network connection, and sit back and wait for the install to complete. You can connect a monitor if you'd like, but I just wait to see a new IP address appear on my router.
If it does not show up, you've done something wrong with the image process or WiFi setup above, and you'll need to troubleshoot or start over.
Accessing the Pi
Now that the Pi is on your network, you'll need to use SSH to access it. For Mac and Linux, SSH clients are usually built in. For Windows, you can download putty. I'm not going to cover more specifics with Windows – you should investigate this on your own.
The initial connection via SSH is documented in a lot of spots, but here's my short version for the Mac. I will SSH in the first initial time, accept the new key from the device, and then share my SSH key so I never have to type a password in again. I also change the default “pi” user password to something complex in the event I do need to get in with a keyboard or mouse. High level steps:
Initial SSH connection
ssh pi@<your Pi's IP address>The default password is “raspberry”. Once I'm in, I change the password using the “passwd” command. I then share my SSH key with the device so I don't have to use a password again. I highly recommend you use passwordless authentication instead of a username and password – read more about how to set that up here.
Update the OS
Before I do anything else, I like to update the OS so I know I'm working from the newest of everything in case I run into an issue:
sudo apt updateOnce that completes, you'll see whether there are updates to be had
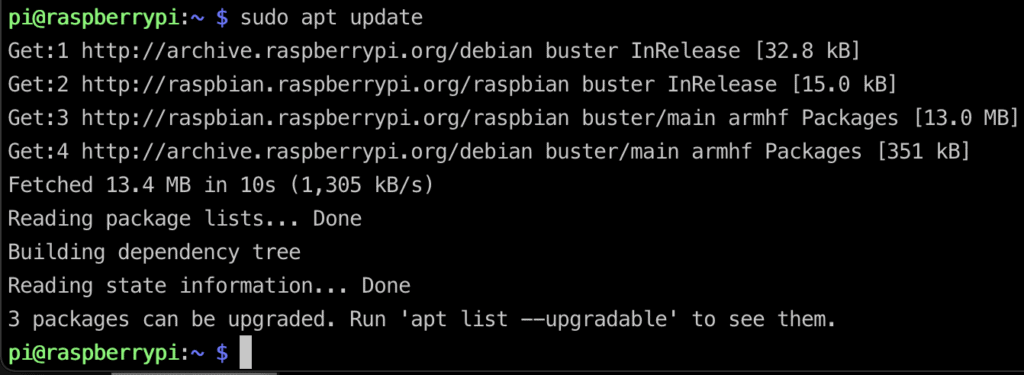
Update the pacakages
sudo apt upgradeOnce that completes, I reboot to make sure there aren't any other updates that need to happen in the background, and then it's time to get into some basic configuration.
Installation Notes
With all of the installation steps below, I assume you are using the “pi” user that has already been created and the commands will assume that. If you choose to create your own user, make sure you have the right permissions with sudo.
Basic OS Settings
There are a number of things I like to do to any Pi image to help with identifying it (hostnames), setting the local timezone, setup automatic updates, etc.
Set the hostname.
sudo hostnamectl set-hostname <your host name>Once you've set the hostname, you'll want to add that to the /etc/hosts file to prevent errors from sudo not being able to find it, and other programs barfing as well.
sudo nano /etc/hostsAfter the entry for loopback and raspberrypi, add whatever hostname you chose:
127.0.1.1 raspberrypi boatpiControl-X to save and exit.
Set correct timezone.
sudo dpkg-reconfigure tzdataSet up unattended upgrades. This allows the operating system to update itself automatically and reboot if needed.
sudo apt-get install unattended-upgrades -y
sudo dpkg-reconfigure --priority=low unattended-upgrades
There are a number of other things that I usually do such as email setup and gateway, setup apticron for email notifications of software updates, and more, but those are more advanced. You can see some notes about this at the end of the article.
After doing all of this, it is a good idea to reboot to get the hostname to show up, and to let things boot back up with the correct timezone.
Installing NMEA 2000 bus tools
There are some operating system level tools and libraries that need to be installed in order to access the NMEA 2000 interface, more generically called CAN-bus.
First, you need to edit the /boot/config.txt file and add these lines to the very bottom of the file, then reboot the system:
enable_uart=1
dtparam=i2c_arm=on
dtparam=spi=on
dtoverlay=mcp2515-can0,oscillator=16000000,interrupt=25
dtoverlay=spi-bcm2835-overlay
These add appropriate devices and configuration for the PICAN-M board.
Once you've done that, we'll need to install the canbus tools
sudo apt-get install can-utils -yThen we need to bring up the CAN-bus/NMEA 2000 interface
sudo /sbin/ip link set can0 up type can bitrate 250000We also want to add this to a startup script so that the command is run every time the system reboots. You'll need to create the following file and copy it into /etc/systemd/system.
nano socketcan-interface.servicePaste the contents of the below into the file. Press Control-X to save and exit.
[Unit]
Description=SocketCAN interface can0 with a baudrate of 250000
[Service]
Type=oneshot
RemainAfterExit=yes
ExecStart=/sbin/ip link set can0 type can bitrate 250000 ; /sbin/ifconfig can0 up
ExecReload=/sbin/ifconfig can0 down ; /sbin/ip link set can0 type can bitrate 250000 ; /sbin/ifconfig can0 up
ExecStop=/sbin/ifconfig can0 down
[Install]
WantedBy=multi-user.target
Copy the file to the appropriate systemd directory and give it the right permissions
sudo cp socketcan-interface.service /etc/systemd/system
sudo chmod 644 /etc/systemd/system/socketcan-interface.service
sudo systemctl enable socketcan-interface.service
To test that things are working correctly, you can use the command candump and see the raw traffic from the NMEA 2000 network.
Warning that this can be a lot of data – to get out of it, press Control-C
candump can0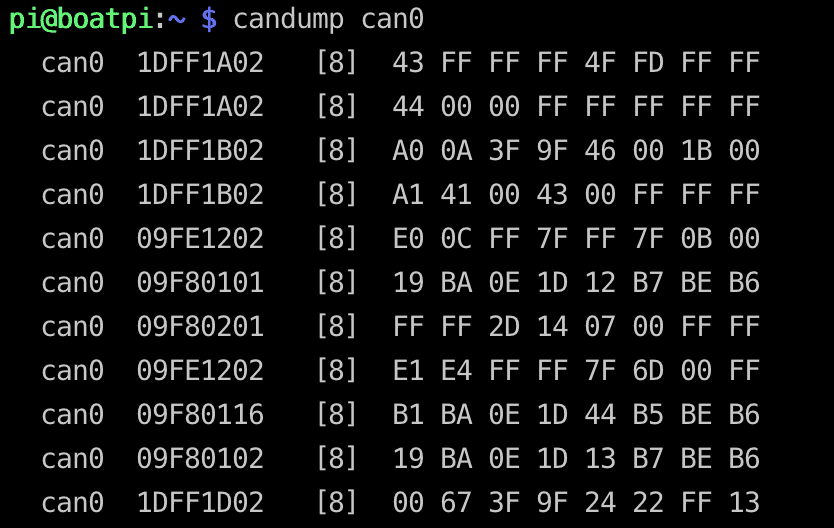
You should see data similar to the above. This confirms that you are getting data from your NMEA 2000 network. If you don't see anything, then you have a cabling issue, configuration issue, or a bad board.
Installing Signal K
These steps help install Signal K and connect it to your NMEA 2000 network. The official Signal K repository has a step by step guide to do this here. I'm going to simplify the steps based on the hardware and goals we have.
Install prerequisites. This is a decent amount of software, so be patient. It includes Node.JS, the engine that Signal K is run off of, and all the supporting packages.
sudo apt install nodejs npm -yInstall latest version of node package manager (NPM)
sudo npm install -g npm@latestInstall secondary dependencies
sudo apt install libnss-mdns avahi-utils libavahi-compat-libdnssd-dev -yInstall Signal K server
sudo npm install -g --unsafe-perm signalk-server -yNow you have Signal K installed but it is not running yet. We're going to go through the setup script below. Run the setup process:
sudo signalk-server-setupOnce the setup script starts, you'll be prompted to choose a number of things. Below are what I recommend – obviously replace your boat name and MMSI.
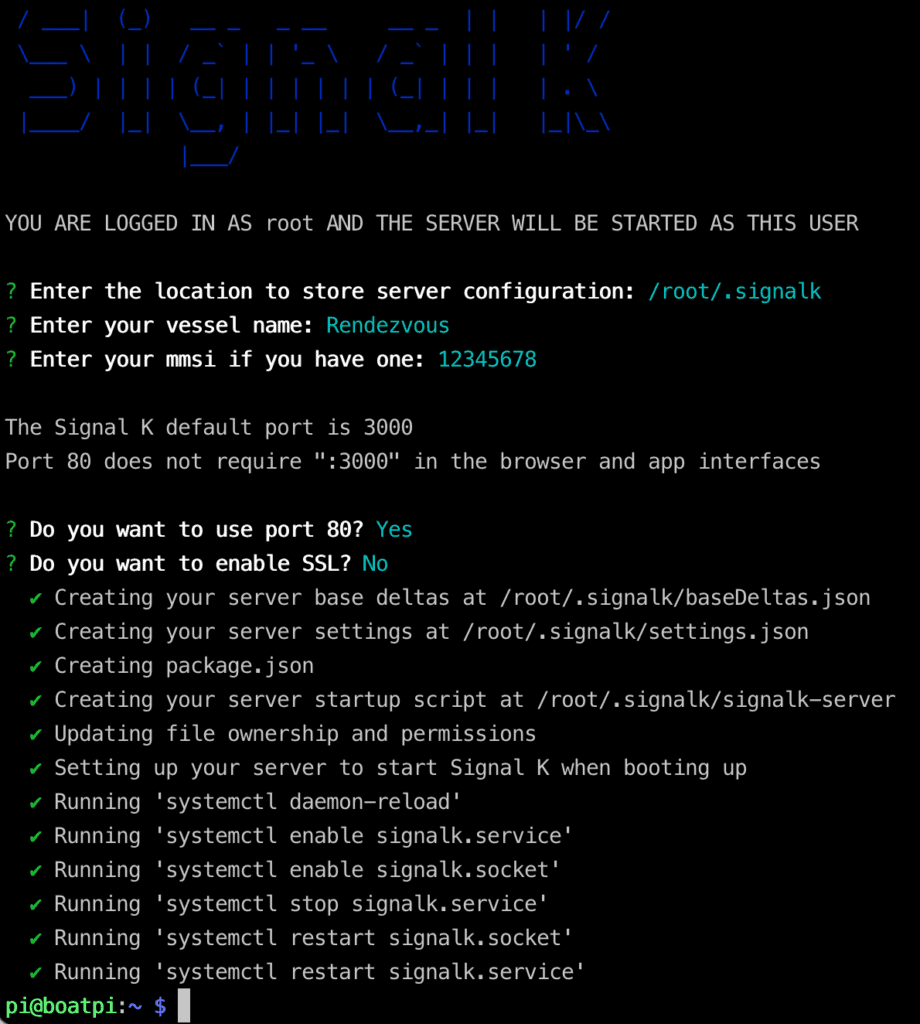
Some may wonder about my choice not to setup SSL – this is your choice, but I have found that serving Signal K over SSL, also known as a secure site or HTTPS, is resource intensive. On a busy NMEA 2000 network, it can add overhead that is not necessary if your network is secure.
We also need to make sure that Signal K starts up after the can0 CAN-bus interface we configured earlier. To do this, we'll need to edit the startup dependencies:
sudo systemctl edit signalk.serviceIn the resultant editor, you need to add this text:
After=socketcan-interface.serviceUse Control-X to save the file. This will ensure that Signal K starts after the CANbus interface.
Once you've done this, Signal K should be installed and initially configured, and set to start up on boot. Let's get it started up and login to the web interface:
sudo service signalk startHead over to a web browser and connect to the IP address or hostname of your Pi – you should get a Signal K screen:
Login as admin (upper right login button) with a password of “signalk”. You should change this at some point.
Configuring NMEA 2000 Interface
Login to the Signal K web interface as admin. Head over to Settings -> Data Connections. Click on Add and configure it as below.
- Data type: NMEA 2000
- Enabled: YES
- Logging: NO
- ID: 1 (this is just a number I chose)
- NMEA 2000 Source: Canbus (canboatjs)
- Interface: can0
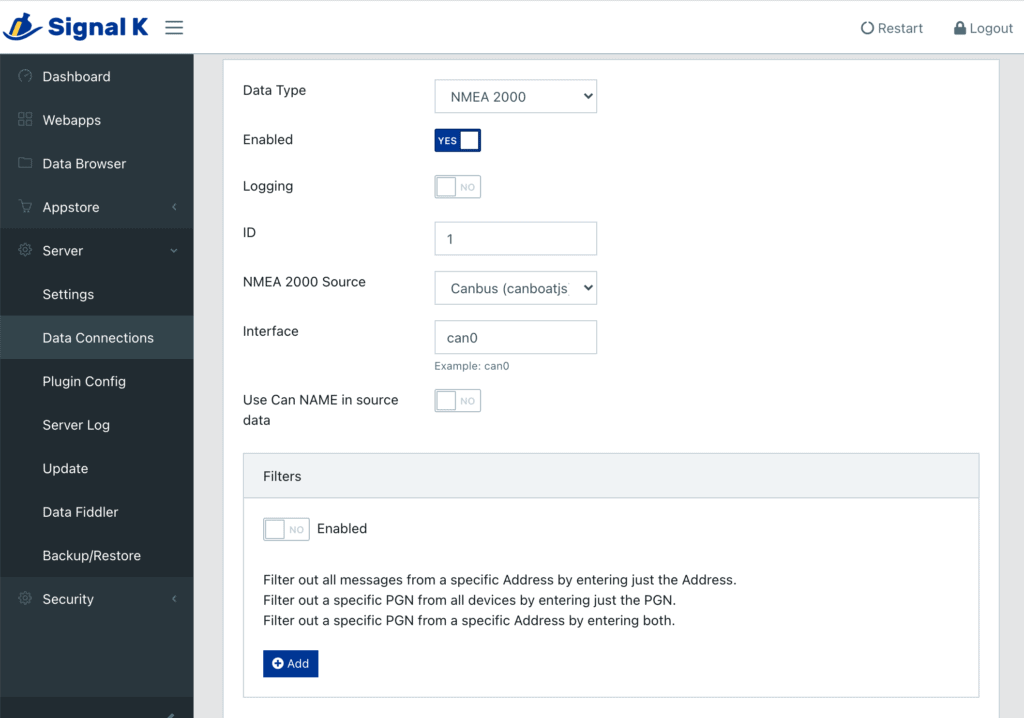
Once you've added it, you'll need to restart the Signal K server (upper right). You have to do this whenever you make a configuration change to the server or plugin, add a plugin, etc.
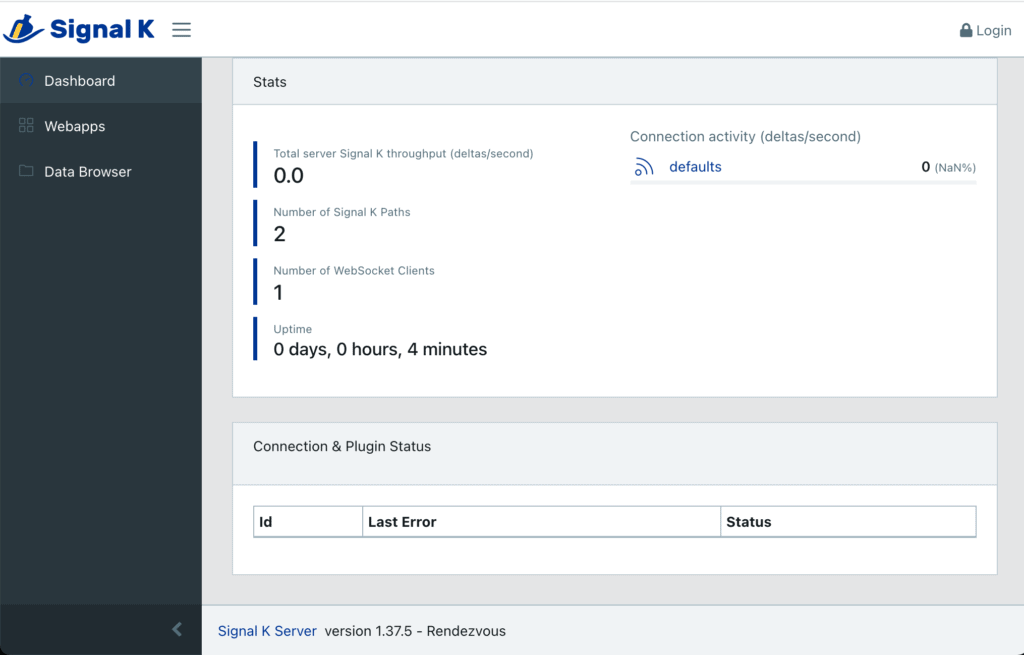
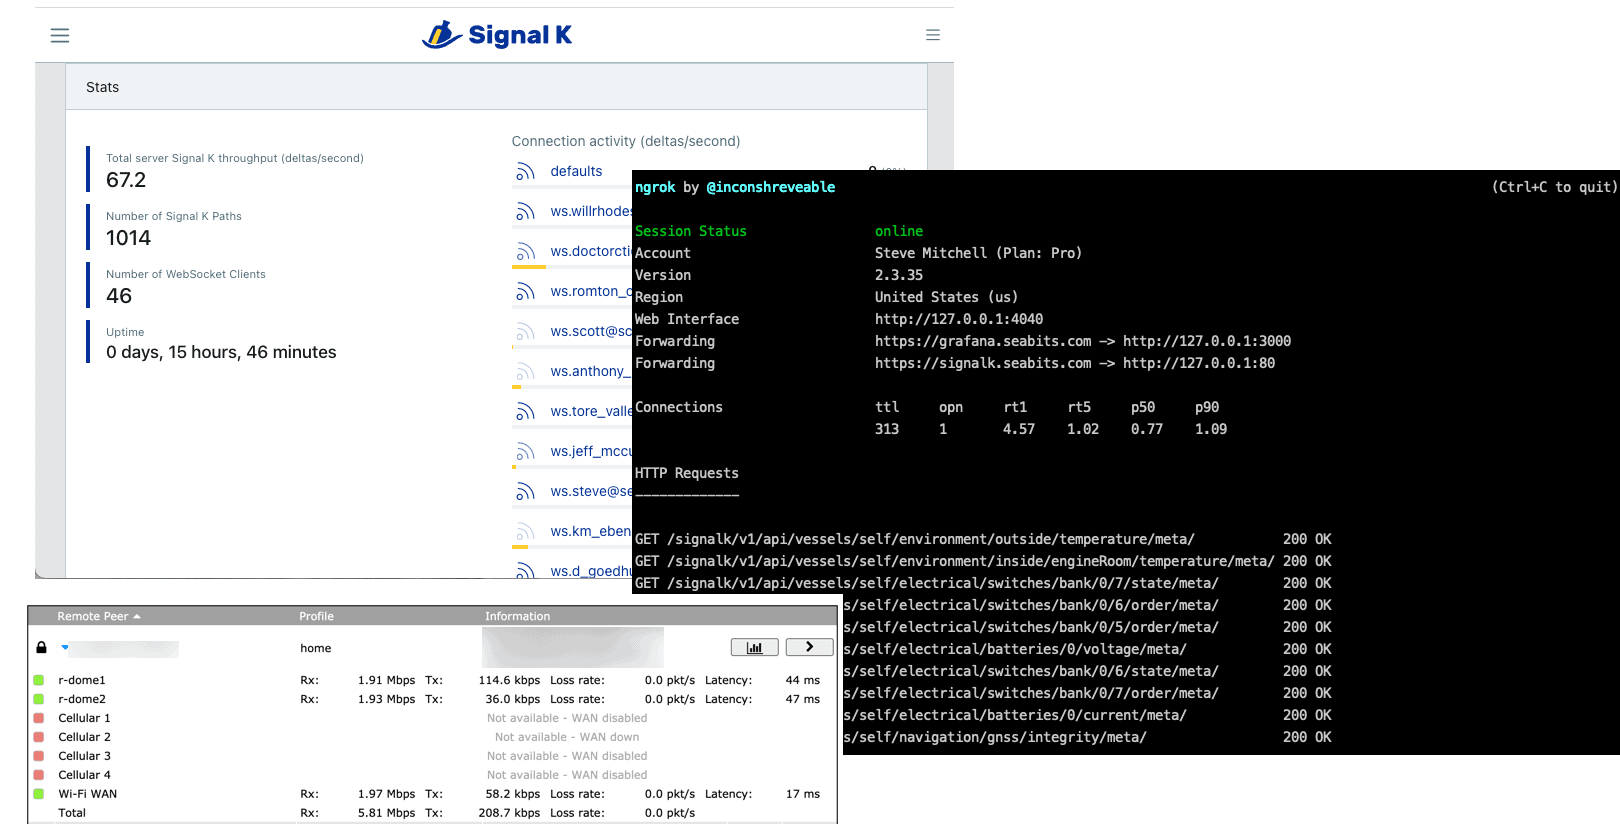
Head back to the dashboard and you should see a couple of things:
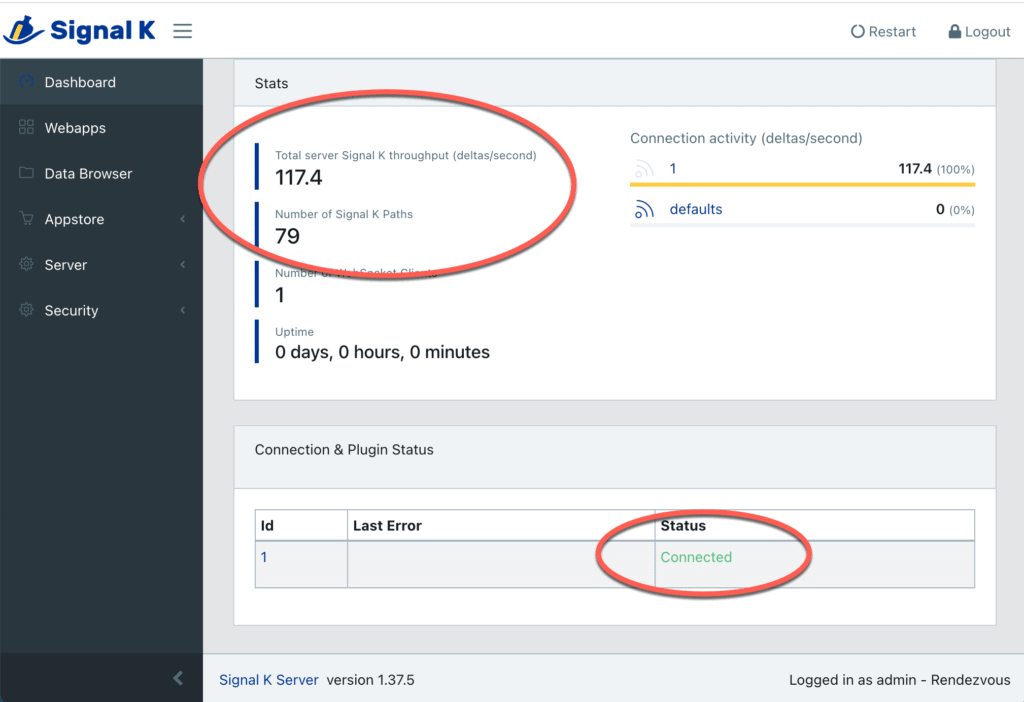
Total server Signal K throughput – should not be zero. There should be some level of messages being detected.
Connection and Plugin Status – you should see one connection and that it is “Connected” – if not, something is wrong with your Signal K configuration or canbus interface.
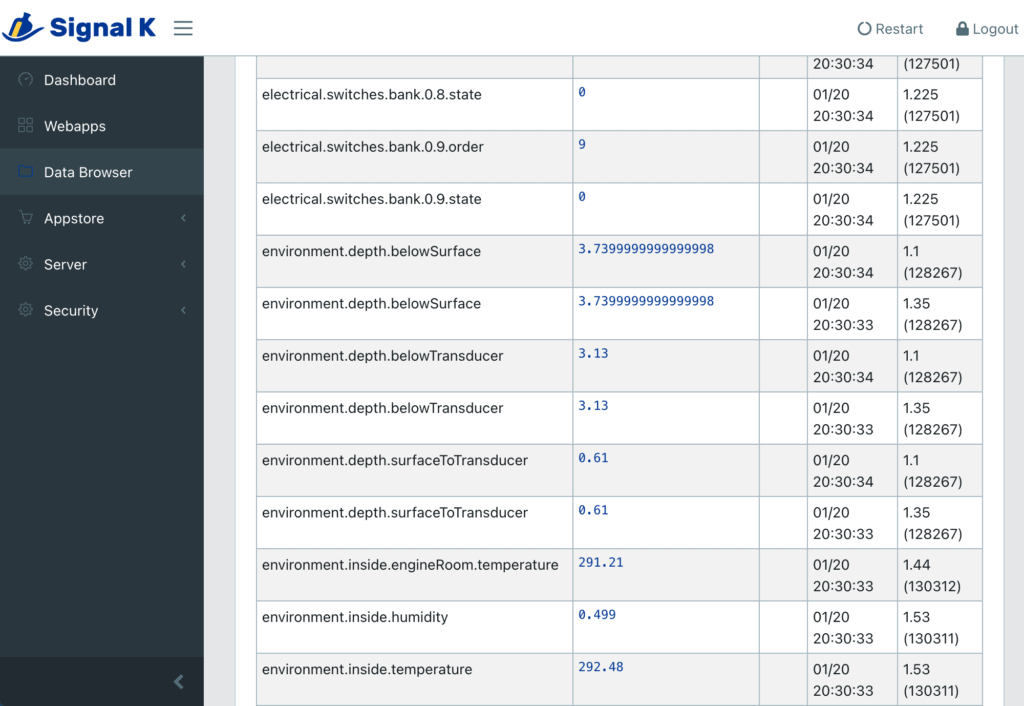
If you have passed these steps, you can also click on Data Browser and see real-time the data from your NMEA 2000 network. You'll see something different than mine above, but you will notice the values updating every so often. Congratulations! You have a working Pi with a Signal K server!
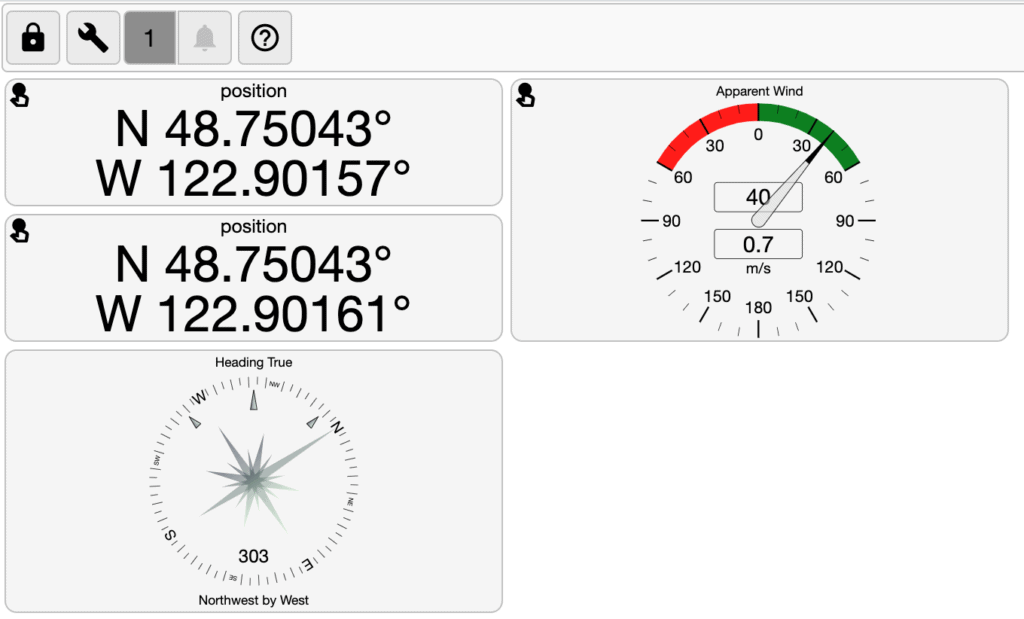
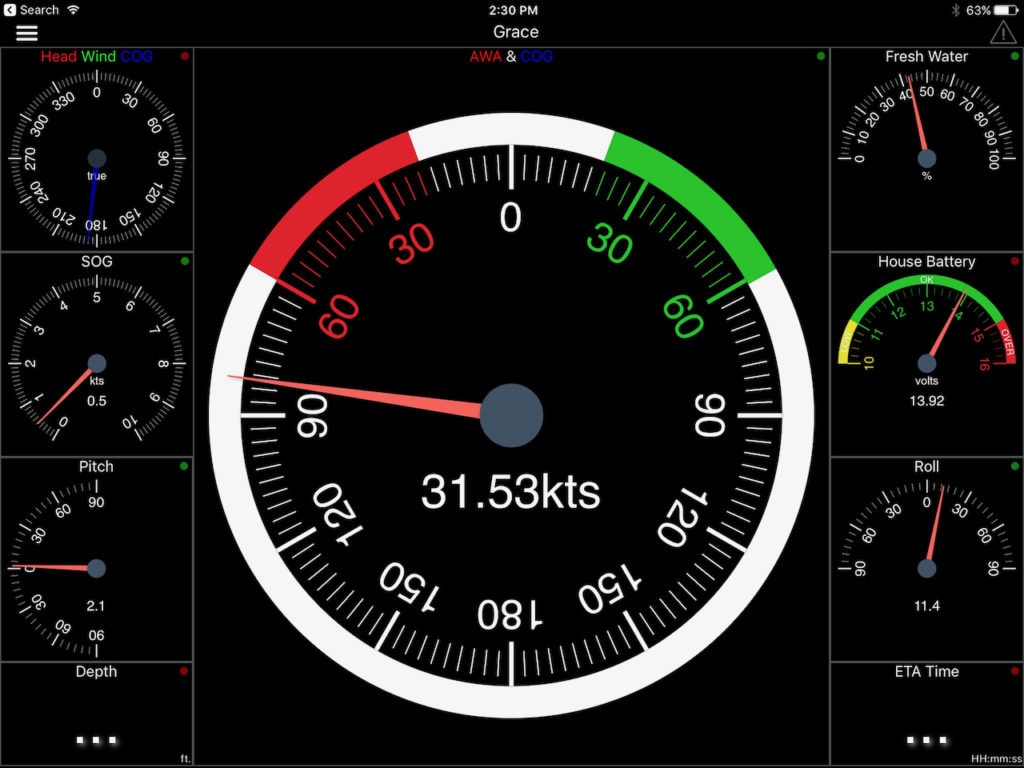
You can also click on Webapps and then the @Signalk/Instrumentpanel. This will take you to one of the swiss army knives of Signal K – a configurable dashboard of gauges and data. I've spent many hours in here configuring dashboards I use on my phone, iPad, and computers for various uses. You can stop here if all you wanted was a real-time dashboard. If you want longer term stats, analysis, and other plugins, keep going.
Common Signal K Plugins to Install
Plugins are pieces of code written that extend the functionality of Signal K. They are easy to install, but require restarting the server whenever you install or upgrade one of them.
In addition, almost all plugins require some sort of configuration. Once you've installed one (or more), and restarted the server, you'll need to go into Server -> Plugin Config and set any of the values you need to get things working. Usually the plugin maintainer page (the little “i” will link you to it) will help you with any details. Again, after changing these values, you'll need to restart the Signal K server.
To install a plugin, click on the little download cloud on the far right hand side, and scroll back up to the top of the screen to see install status. You can also click on the little “i” on the left and learn more about it. Once you're done, don't forget to restart the server (upper right corner).
signalk-derived-data
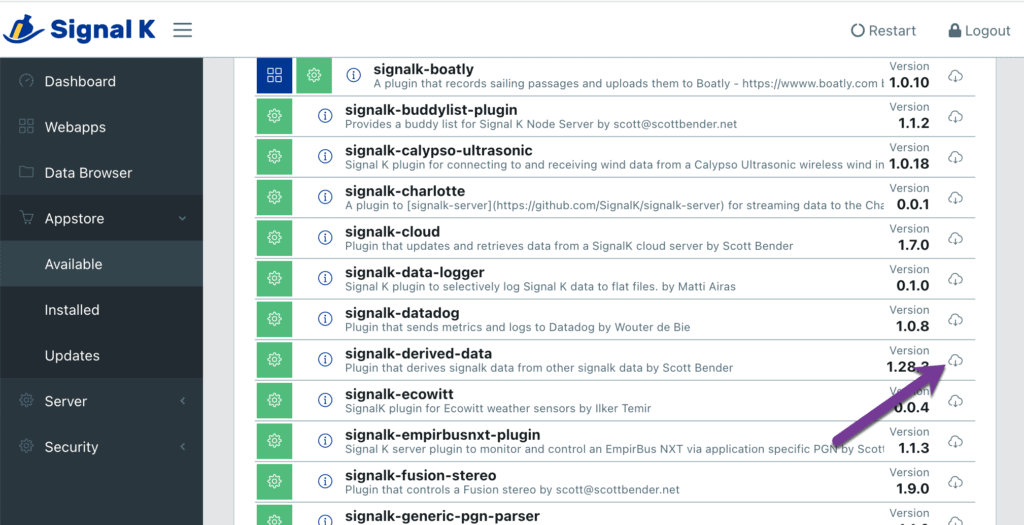
The most important one to install is signalk-derived-data which generates other data from stuff being input into Signal K – examples include: Outside air density (based on humidity, temperature and pressure), Outside air dew point (based on humidity and temperature), tank volume, and much more. You can read all about it at signalk-derived-data.
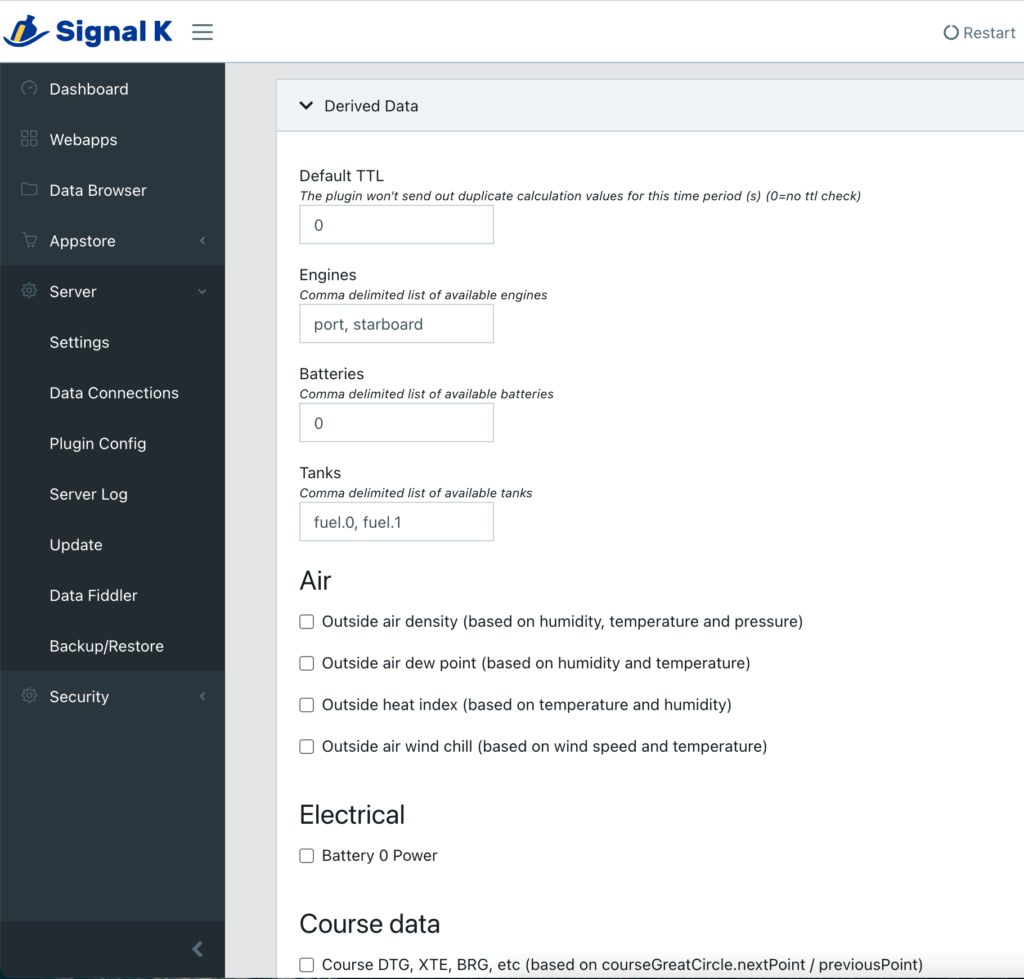
Once you've installed it, there are bunch of configuration options. You can enable various items depending on what data you're missing – for instance, if you have wind speed and outdoor temperature, but nothing on your network produces wind chill temperature values, check the “Outside air wind chill” box and restart the Signal K server. You'll now have a calculated wind chill amount!
Look through the data in here, and if you think you don't have it on your network, turn it on. This will allow you to log this information elsewhere and use it on dashboards.
signalk-raspberry-pi-temperature
I install this one to keep an eye on the temp of my Raspberry Pi. My network is pretty extensive, and I've seen it get very hot when it is overwhelmed. This shows up as another bit of data in Signal K and you can see it in the instrumentpanel as well.
signalk-wilhelmsk-plugin
I always install this one because it has a companion iPhone/iPad application that is absolutely amazing – the plugin is only required if you have an Apple Watch. It's written by one of the key Signal K developers and I highly recommend it as a way to see all of the data real-time from your boat on an iPhone or iPad.
You can find out more about the app at WilhelmSK.
Installing InfluxDB + Grafana
One of the most popular reasons to set this hardware up is to get longer term dashboards and graphs. I covered some of the ones I use in Engine and Power Dashboards. To do this I use InfluxDB to store the data, and Grafana to graph it.
Teppo Kurki covers using docker to install this on the plugin home page, but I prefer to install the requisite software directly in the operating system on a “production” system to save on the overhead of docker, and because that's all this system is doing, and it makes it easier to manage (in my opinion) if it's installed this way. It does take a few steps, covered below.
Install InfluxDB
Influx is the time-series database that Signal K will be sending all of its data to. This is an efficient and easy way to store data, and will allow Grafana, the graphing piece, to connect and create your fancy graphs. Let's get started:
Install the InfluxDB key and repository
wget -qO- https://repos.influxdata.com/influxdb.key | sudo apt-key add -
echo "deb https://repos.influxdata.com/debian buster stable" | sudo tee /etc/apt/sources.list.d/influxdb.list
Note that the above command is for the most current release of Raspberry Pi's operating system, Raspbian, version 10 called “buster”. You may have to adapt the repository information if you're using a different version.
Update your repository data, and install influx.
sudo apt-get update && sudo apt-get install influxdbStart up InfluxDB
sudo service influxdb startNow it's time to create the database we'll be storing your data in – I recommend using your boat name as the database name.
Start the InfluxDB command line
influx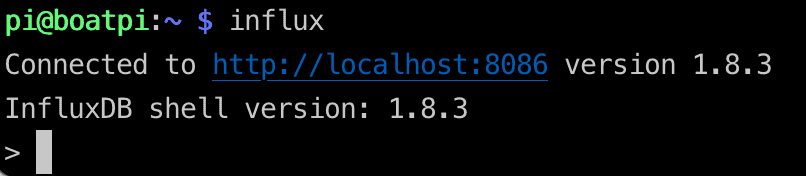
You should connect to your InfluxDB server and see a prompt. If you don't, something isn't right with the database.
Lets create your database and the user that Grafana will use to query it.
create database <your boat name>
create user <your boat name> with password '<password>'
To make sure the database and user are created, run the following commands
> show databases
> show users
You should see something like this
> show databases
name: databases
name
----
_internal
rendezvous
> show users
user       admin
----       -----
rendezvous false
>
Congrats! The database is installed. Let's point the Signal K plugin at it and see what happens. You can leave this influx command line running as we'll need it to verify the data is making it into the database.
Setting up signalk-to-influxdb plugin
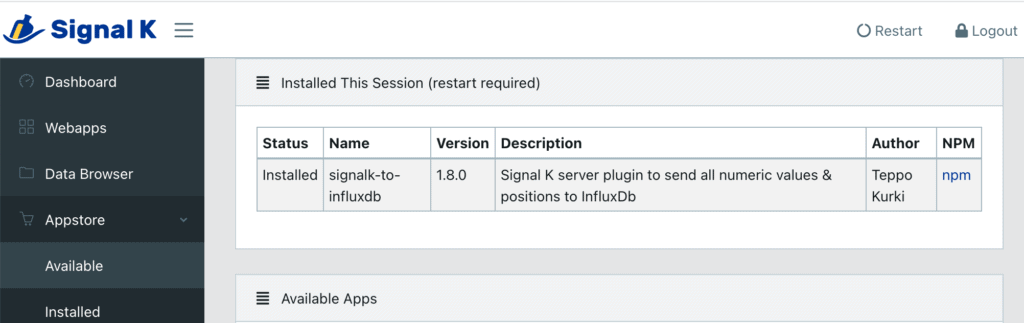
You'll want to install the signalk-to-influxdb plugin from the Signal K web interface under Appstore -> Available. Once installed, restart the Signal K server so it shows up in Plugin Configuration.
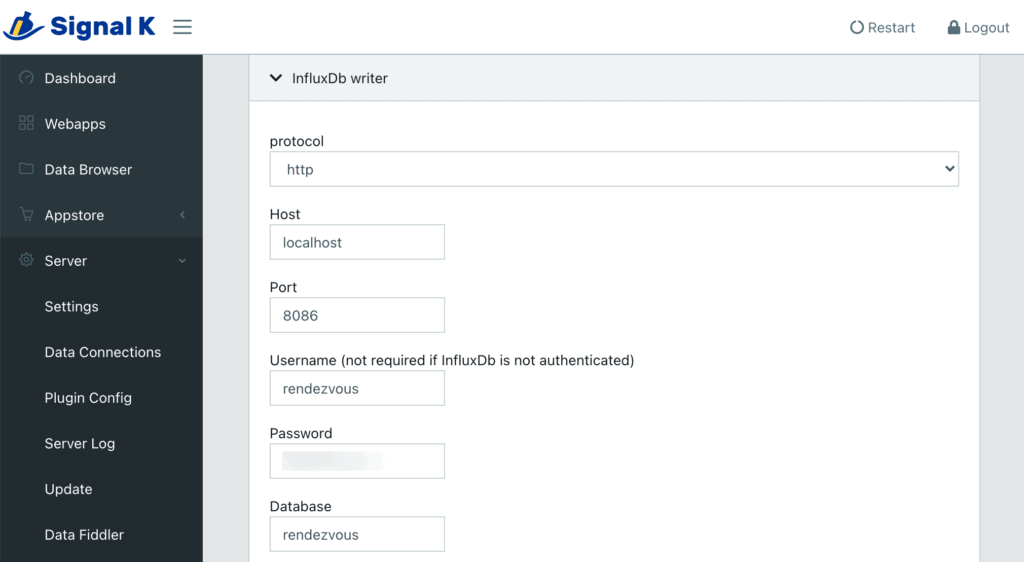
Go to Server -> Plugin Config, and expand InfluxDb writer. Under the username, password, and database, use the data you set up in the steps above. Leave all of the other settings at their defaults, scroll down and hit Submit, and then restart the Signal K server again.
To validate that data is flowing into Influx, head back to the SSH session you left open with the influx command line running.
Switch to your boat database
use <boat / database name>Show measurements being recorded
show measurementsYou should see a bunch of line items that represent the various data Signal K is sending across to the database, like this:
> use rendezvous
Using database rendezvous
> show measurements
name: measurements
name
----
electrical.ac.0.phase.A.current
electrical.ac.0.phase.A.frequency
electrical.ac.0.phase.A.lineNeutralVoltage
electrical.ac.0.phase.A.realPower
electrical.ac.0.total.realPower
electrical.ac.1.phase.A.current
electrical.ac.1.phase.A.frequency
electrical.ac.1.phase.A.lineNeutralVoltage
electrical.ac.1.phase.A.realPower
electrical.ac.1.total.realPower
electrical.batteries.0.capacity.stateOfCharge
electrical.batteries.0.capacity.timeRemaining
electrical.batteries.0.current
electrical.batteries.0.voltage
electrical.batteries.1.voltage
electrical.switches.bank.0.1.order
electrical.switches.bank.0.1.state
electrical.switches.bank.0.10.order
electrical.switches.bank.0.10.state
electrical.switches.bank.0.11.order
electrical.switches.bank.0.11.state
electrical.switches.bank.0.12.order
electrical.switches.bank.0.12.state
electrical.switches.bank.0.2.order
electrical.switches.bank.0.2.state
electrical.switches.bank.0.3.order
electrical.switches.bank.0.3.state
electrical.switches.bank.0.4.order
electrical.switches.bank.0.4.state
electrical.switches.bank.0.5.order
electrical.switches.bank.0.5.state
electrical.switches.bank.0.6.order
electrical.switches.bank.0.6.state
electrical.switches.bank.0.7.order
electrical.switches.bank.0.7.state
electrical.switches.bank.0.8.order
electrical.switches.bank.0.8.state
electrical.switches.bank.0.9.order
electrical.switches.bank.0.9.state
environment.depth.belowSurface
environment.depth.belowTransducer
environment.depth.surfaceToTransducer
environment.inside.engineRoom.temperature
environment.inside.humidity
environment.inside.temperature
environment.outside.dewPointTemperature
environment.outside.humidity
environment.outside.pressure
environment.outside.temperature
environment.water.temperature
environment.wind.angleApparent
environment.wind.speedApparent
navigation.attitude.pitch
navigation.attitude.roll
navigation.attitude.yaw
navigation.courseOverGroundTrue
navigation.datetime
navigation.gnss.antennaAltitude
navigation.gnss.geoidalSeparation
navigation.gnss.horizontalDilution
navigation.gnss.integrity
navigation.gnss.methodQuality
navigation.gnss.positionDilution
navigation.gnss.satellites
navigation.gnss.type
navigation.headingTrue
navigation.log
navigation.magneticDeviation
navigation.magneticVariation
navigation.rateOfTurn
navigation.speedOverGround
navigation.speedThroughWater
navigation.speedThroughWaterReferenceType
navigation.trip.log
tanks.freshWater.1.capacity
tanks.freshWater.1.currentLevel
tanks.fuel.0.capacity
tanks.fuel.0.currentLevel
You may not have all of these items, but you should have some. If not, you have an issue with your database name, password, or configuration.
If you have data, you've got the hard part done. Now we get to install Grafana and start graphing!
You can now exit out of the influx shell by typing “exit”.
Install Grafana
To install Grafana you need to install a few things, including the repository information for the software.
wget -q -O - https://packages.grafana.com/gpg.key | sudo apt-key add -
echo "deb https://packages.grafana.com/oss/deb stable main" | sudo tee -a /etc/apt/sources.list.d/grafana.list
Update the repos and install Grafana
sudo apt-get update
sudo apt-get install -y grafana
Enable Grafana to automatically restart at boot
sudo /bin/systemctl enable grafana-serverStart up Grafana now
sudo /bin/systemctl start grafana-serverGrafana should be running – head over to a web browser and go to http://<ip addres>:3000, where the IP address is the address that you have been using to connect to your Raspberry Pi.
Log in to Grafana with the default username admin, and the default password admin. Change the password for the admin user when asked.
You've now got all of the software set up and running!
Adding InfluxDB data source to Grafana
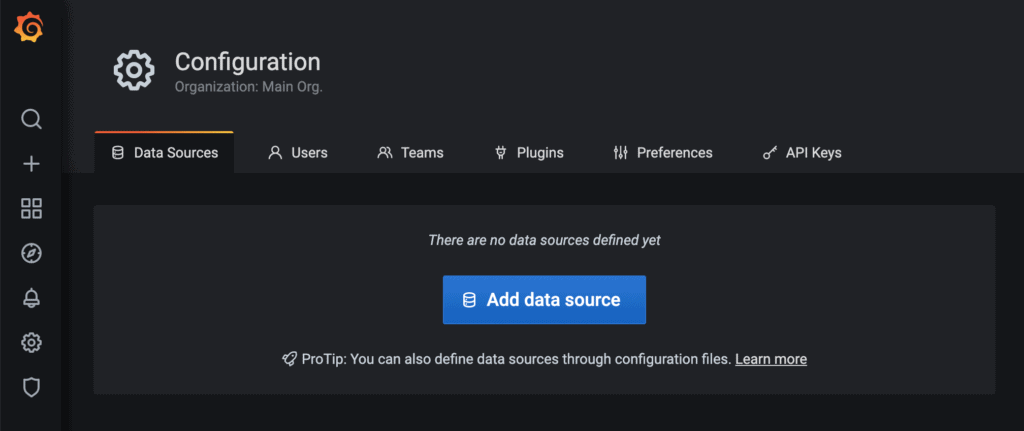
In order for Grafana to be able to graph your boat data, you'll need to add a datasource that points to your InfluxDB database. In Grafana, go to Configuration -> Data Sources and click on “Add data source”
Select InfluxDB as the data source type
On the resulting screen, give it a useful name (I use my boat name, which is the same as the database name) and populate the URL field with http://localhost:8086, which is the address for your local InfluxDB server.
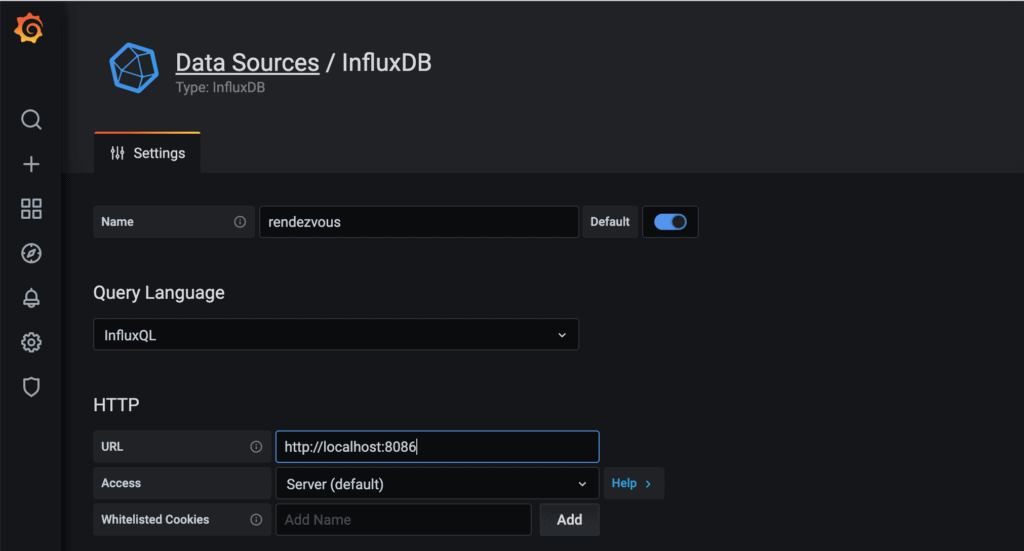
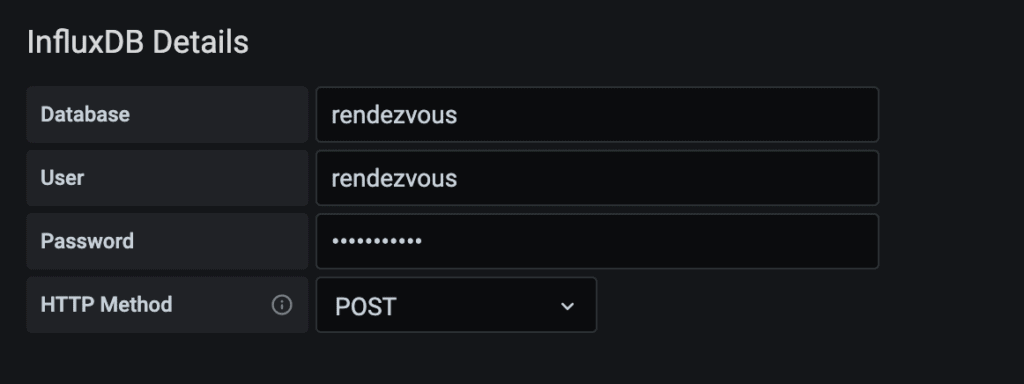
Scroll down a bit further and add your database name, username, and password, which we configured back in the InfluxDB section. Also choose your HTTP Method – I use POST.
Scroll down and choose “Save and Test” and make sure you get the green messages that things have succeeded. If they do not, you have the wrong database, URL, password, or Influx is not running.
Create a Basic Dashboard
To test things out, let's create a simple dashboard to see if data is updating.
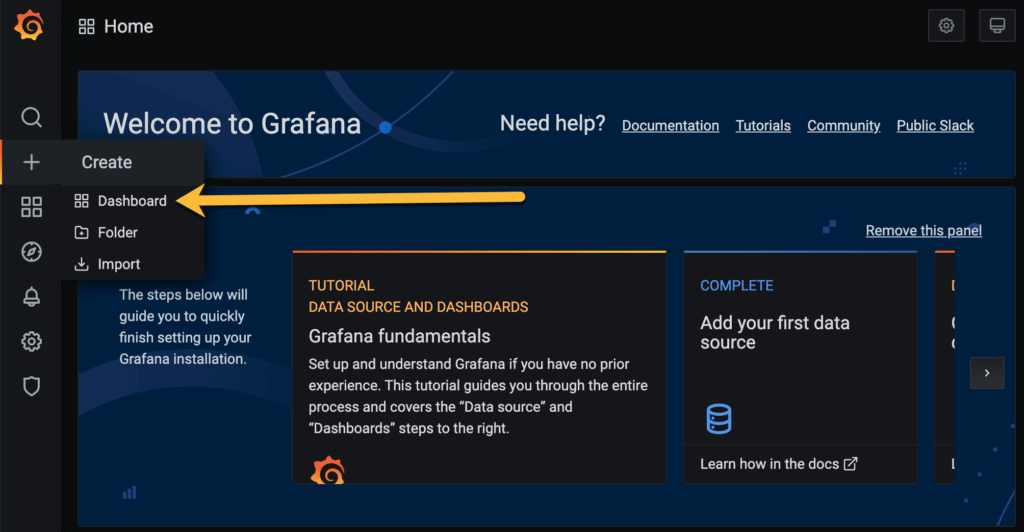
To do this, in Grafana, go to the plus sign in the left hand navigation (Create) and click Create Dashboard.
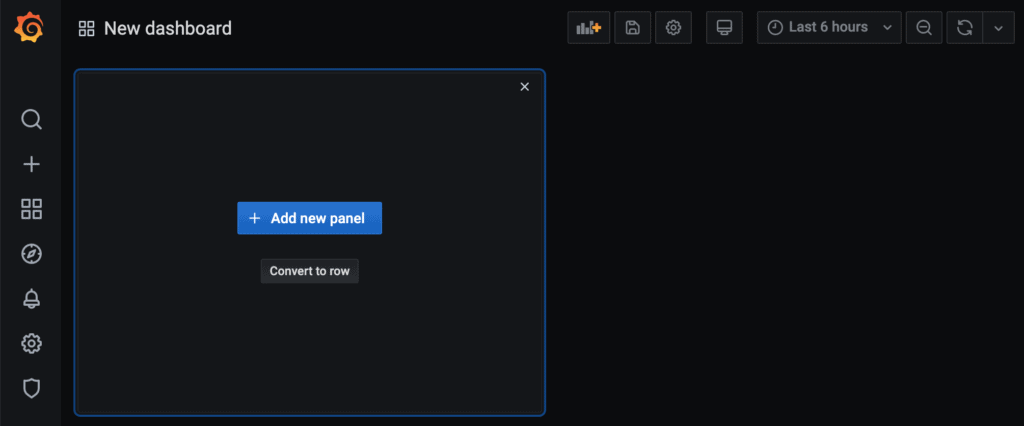
Click Add New Panel
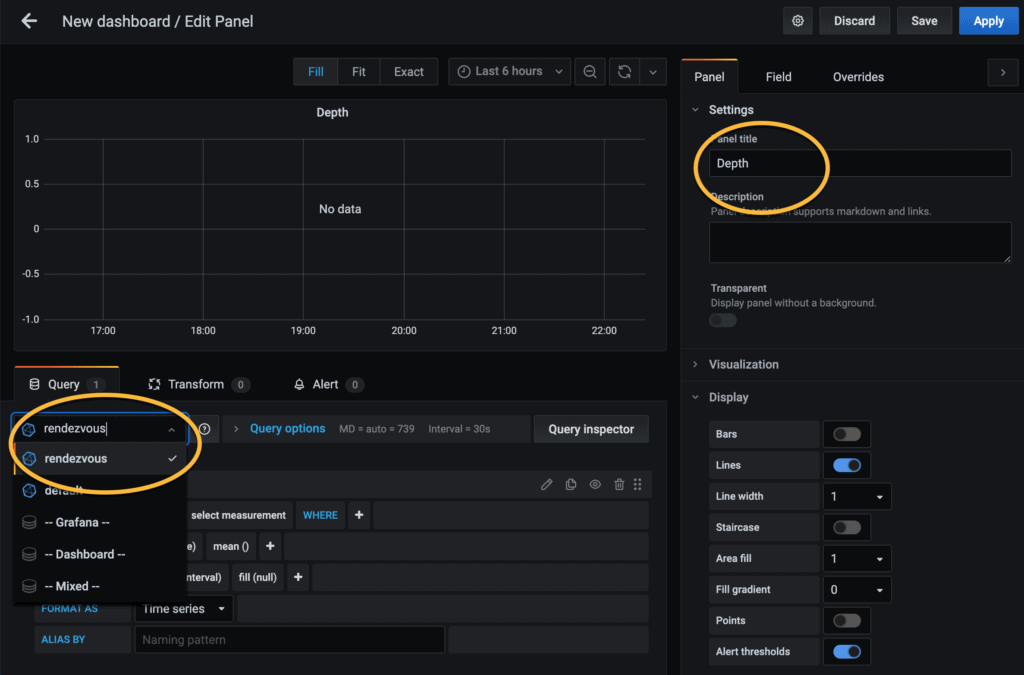
There are a LOT of things on this screen – this can be overwhelming, but it is what gives Grafana the power to create just about any dashboard and represent the data in creative ways.
The first thing we need to do is choose the database – you can see my boat name in the drop down on the left that I've circled. Second, I gave the panel a name – we're going to be searching for depth.
Click on the “select measurement” field
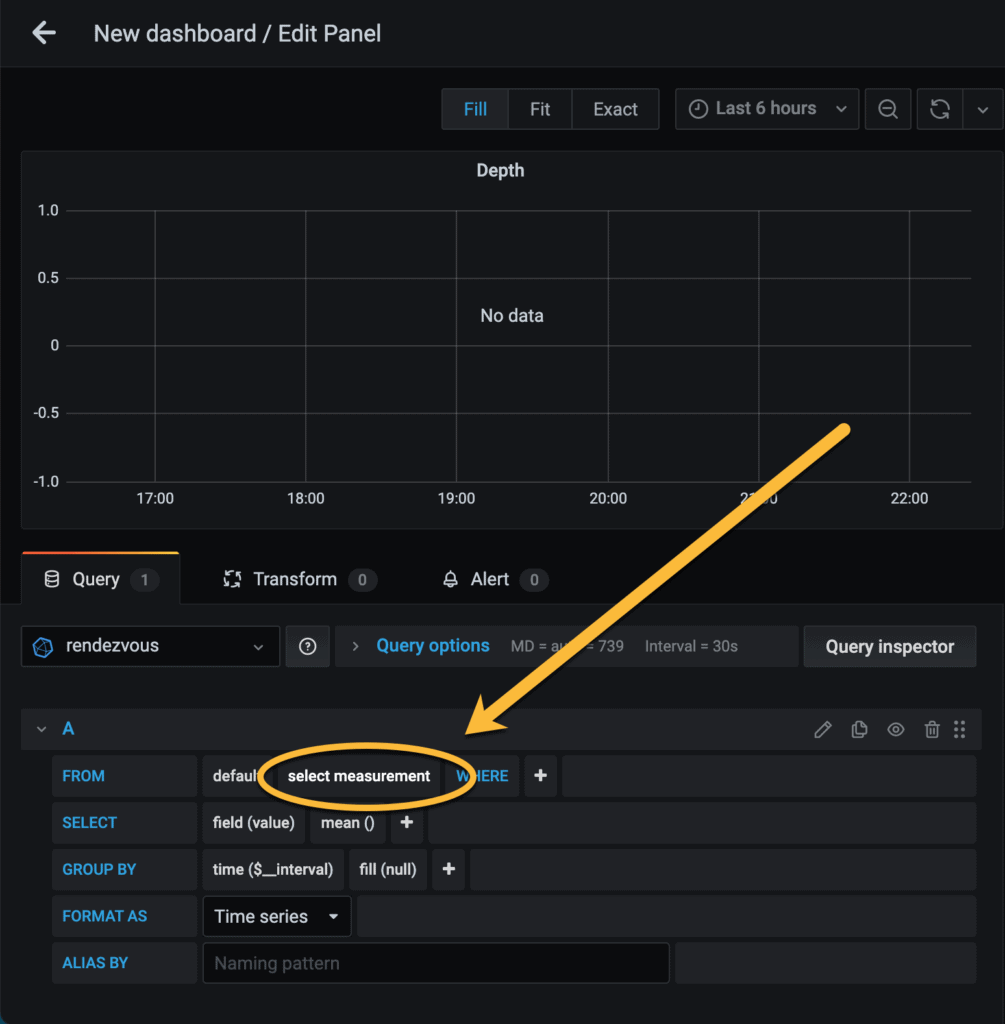
You should see a drop down list of the same data fields that you saw in Influx show up here. If you don't, you've selected the wrong database or have another issue.
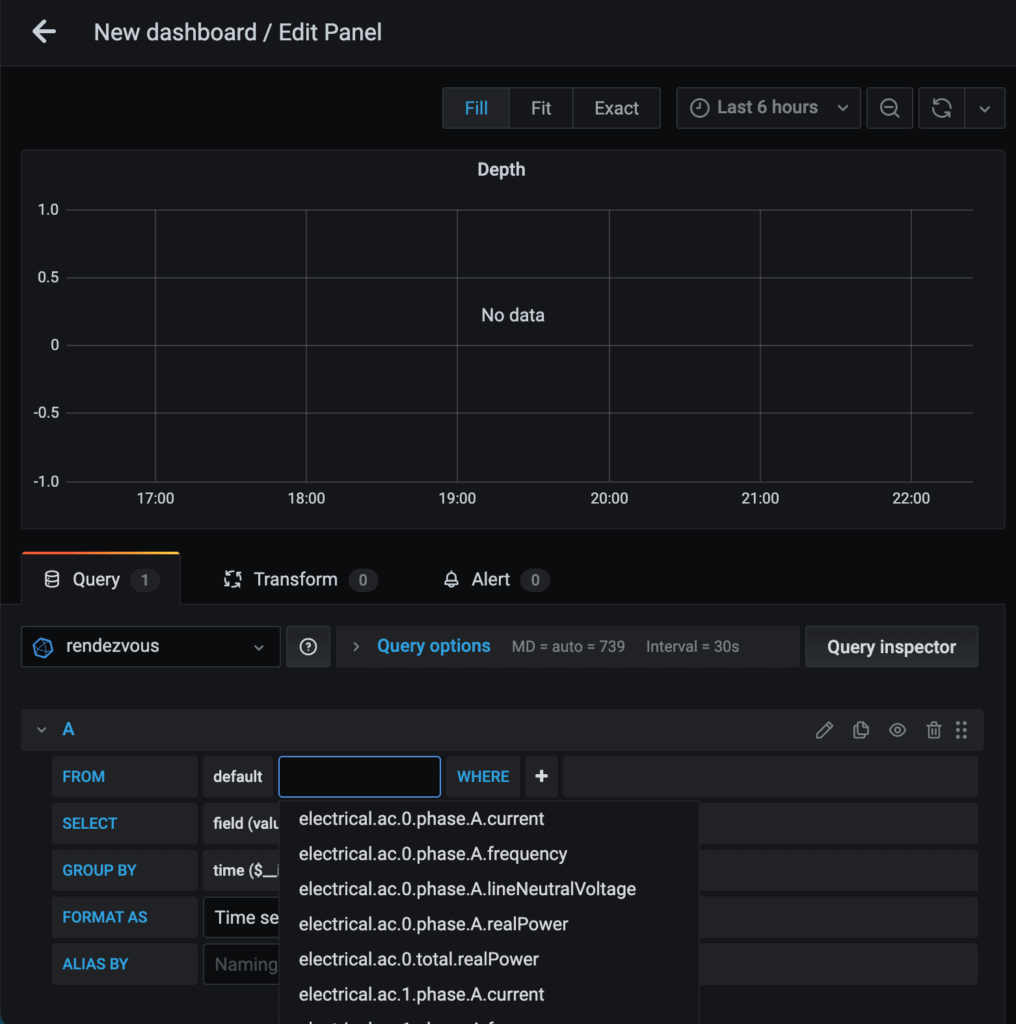
Type in “depth” to filter just to those results. If you don't have depth on your network, try something else, or pick one of the first ones that come up.
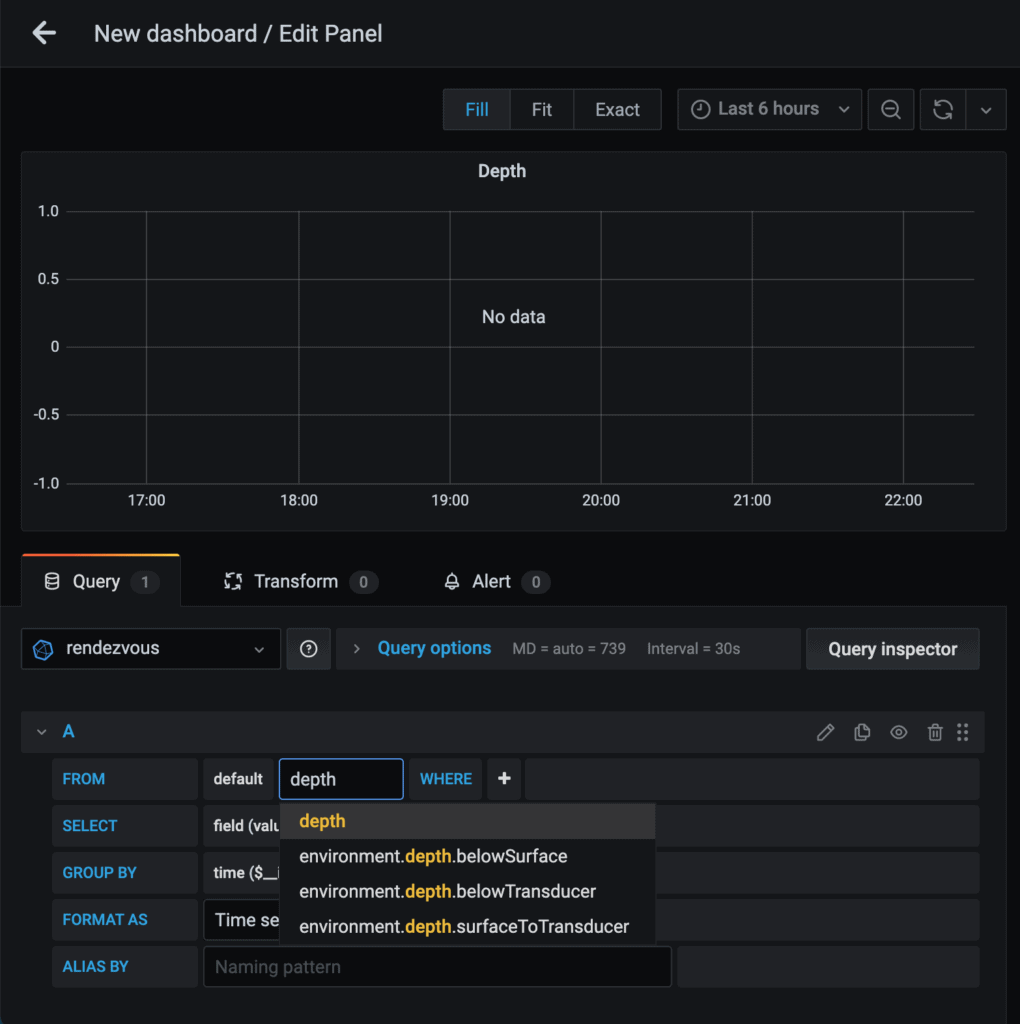
Choose one of the resulting items – I chose depth.belowTransducer
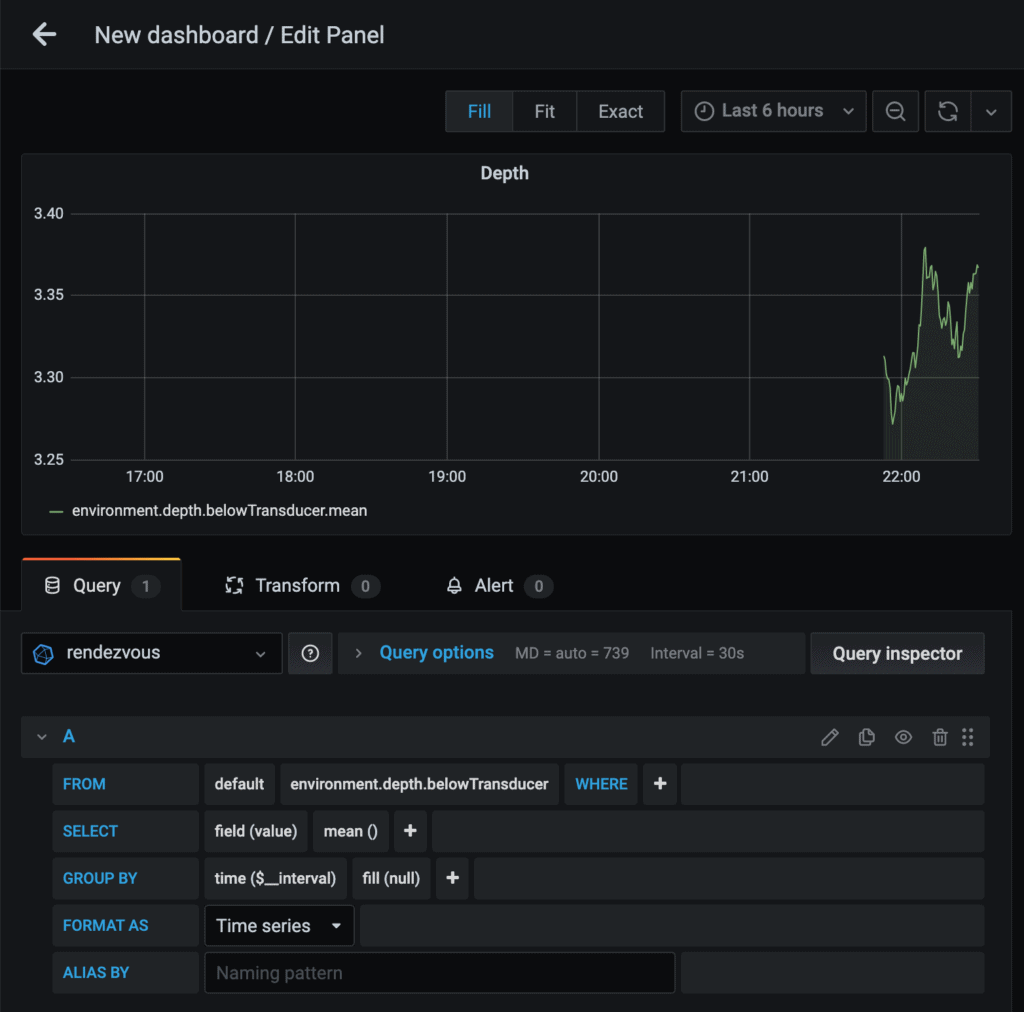
You should see data show up on the graph at the far right – it might be very little data depending on how long your Influx database has been running. If you don't see data, you have either chosen a metric that has no data, or you have some other issue. Try another one until you see something.
When you're done, click Apply in the upper right. You should be taken back to the main dashboard page.
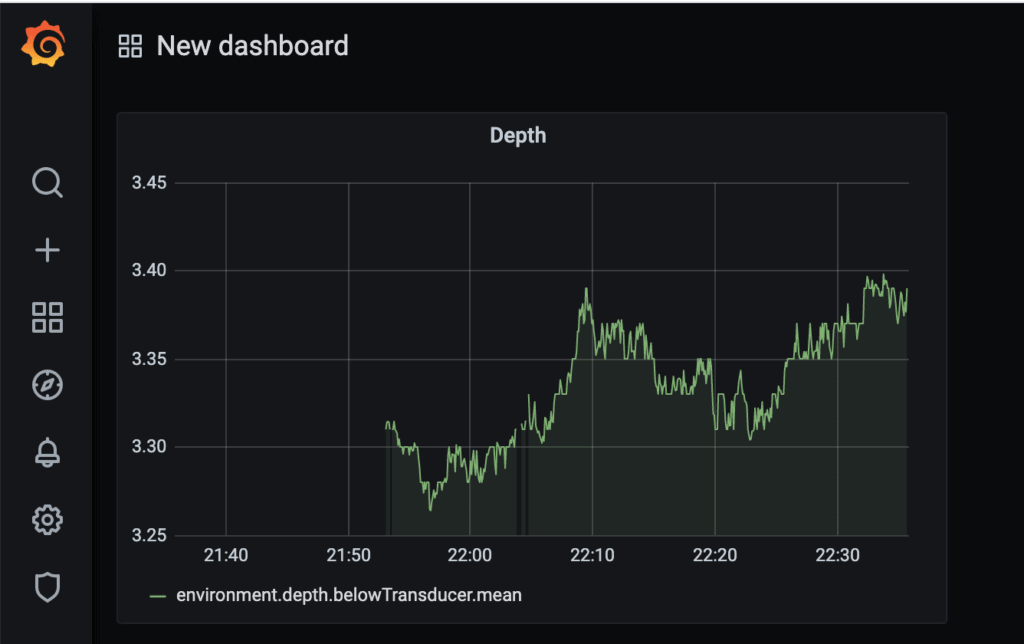
You can zoom in further with the controls in the upper right, and save your dashboard with the disk/save icon.
Keep in mind this is a basic graph – data from NMEA 2000 is often in standard formats that might not make a lot of sense and need to be converted when you create a graph. The one above is in meters, which is fine for those of us who like that. An example of a graph that you would need to work on more would be temperature – they are almost always in Kelvin, which is …. useless to the average human. To convert it, you need to use a math() function within Grafana like below
math(* 9/5 -459.67)That's a subject for another article. Some of it you can see in Engine and Power Dashboards or Real-time weather from the boat.
What have I done?
You have the following:
- A simple operating system that keeps itself updated
- No extra window manager or other junk to waste data and eat CPU
- Reliable, low power hardware
- Signal K server installed with key plugins
- A CAN-bus/NMEA 2000 interface configured and running to feed data to Signal K
- A time-series database logging lots of good NMEA 2000 data
- A graphical dashboard system that you can build on
What's Next?
- Build more graphs – my Engine and Power Dashboards graphs are available to download at the end of the article. Some of the graphs will require customization because the names of my data points may be different than yours, and your database name will also be different.
Explore other metrics in your database and see what they look like on a graph. You don't have to use normal bar or line graphs either – there are icons, gauges, and many other things to explore. - Explore Signal K plugins – go into the Signal K server and look at App Store -> Available and explore the huge list of other things Signal K can interface with. Fusion stereos, autopilots, Windy weather station, and more!
- Explore Signal K Webapps – some of the plugins are actually full apps, like InstrumentPanel. There also insanely configurable frameworks like NodeRed, which allow you to write conditional rules – i.e. if Signal K detects your boat has left the slip based on GPS location, and the bilge pump switch is not on yet, to turn on an alarm or send an email notifying you of the condition. The possibilities are endless!
Advanced Topics
Some things people ask about that are more advanced:
- Cloud / remote access – this applies to both Signal K in general and Grafana in particular. Signal K has a cloud service that you can install via a plugin that will allow remote access, as well as anyone else. Keep in mind that you're letting a 3rd party have access to your boat data, and that it makes it all public, so bear that in mind for security purposes.
For Grafana, some have looked at the Grafana cloud service. If your boat network has a public IP address, and you're willing to poke a hole in your firewall, this might work. If you're using a cellular connection, in almost all countries they do not allow this – there are tons of devices and firewalls between your connection and the outside world. You can use a proxy service, which is similar to the Signal K model.
The most secure solution is a VPN, where you either have the Pi connect to a remote service that you can connect to with your remote device.
- Notifications – see below under Other Things to Consider – you can setup email notifications, but also folks have asked about Signal K notifications, Grafana notifications, etc. Each of those have their own pros/cons and multiple options. Signal K has at least 3 plugins that do notifications through Amazon services, IFTTT, and more. Grafana has various threshold notifications that can also use various services. It really depends on what you want
Keeping Things Updated
Operating system updates should be automatic, to a point. You can login every so often and update software using apt, but you shouldn't have to for critical security updates. You can adjust these settings more so that other software is updated automatically as well.
Signal K and the plugins will need to be updated from within Signal K itself.
Other Things to Consider
Here are some additional things you may wish to consider. Most of these are basic things you can do with any computer running Linux, and can be found by googling the basic gist of what is recommended. I don't document them here since some are advanced, and the steps change.
- Static IP address or DHCP reservation – the default configuration is for your Pi to request an IP address from your router, and that could change if you turn it off for a while or something else happens, like you reboot your router. You can set up a DHCP reservation on your router (if it supports it) or go through the process of giving it a static IP address.
- Local email – by default no email can be sent from your Pi since it doesn't have an email server installed that the Internet will allow you to randomly send from. This is due to spam and other protection policies in place. I always like having an email server so I get alerts about bad things happening on the system, software updates, or use it for other alerting purposes. I recommend postfix as an email server, and Mailgun as the delivery point. Steps for setting this up can be found many places online.
Wrap Up
I hope you found this useful. I am sure some of the steps will be outdated the moment I publish this, so please let me know in the comments.
Archived Comments
These are read only comments from the old system. Scroll down to participate in SeaBits Discussions, our new interactive forum attached to each article.
Dirk
January 30, 2021 at 1:04 pm
Very timely for me, and easy to follow. A couple things I observed during my installation:
* command “switch” in influx db didn’t work, “use” worked
* Grafana port changed to 3001, since 3000 was taken by signalk
- Steve Mitchell
January 30, 2021 at 1:08 pm
Thanks Dirk!
I’ll change the “switch” command to “use” – that’s definitely an error.
You should be able to choose port 80 for Signal K which would mean you could use port 3000 for Grafana.
Mike Harrington
January 31, 2021 at 6:52 pm
Great article!
Timely for me as well. I started the setup on the boat. Installed tailscale (for remote access) and then headed home and finished it up. Pretty much everything worked the first time. The only hiccup (and it was *very* small) was during the Grafana setup. Grafana greys in “https://localhost:8086” but if you don’t type it in, it’s not really there.
I’m interested in your future article on remote access. Tailscale was so easy. I’ve fought with VPNs for so long I was incredibly surprised to have remote access work the first time with almost no config across four OS’s and multiple ISPs.
- Steve Mitchell
January 31, 2021 at 10:45 pm
Glad the article helped!
There are a lot of solutions for remote access including VPNs, both traditional and Tailscale-like, as well as proxies, cloud servers, and more. Tailscale is easy because of the low barrier to setup and architecture, but some may prefer the older-style VPN for different security reasons. I’ll be covering as many as I can, but there are always new ones out there that are making it easier and simpler – you just have to judge cost vs. ease of use vs. security. Tailscale and another similar solution were already on the list! - Mike Harrington
February 1, 2021 at 7:41 am
So true. I would also add in “ease of maintenance”. Bit-rot, OS upgrades, and similar things vary between the remote access solutions. I have a lower tolerance for software maintenance time on the boat…
BoatGuyBill
February 7, 2021 at 8:18 am
Steve – I have a Yacht Devices YDEN-02 aboard. Doesn’t this preclude my need for a nmea hat on any Pi I might install, so long as it’s connected to my network?
- Steve Mitchell
February 7, 2021 at 9:57 am
Bill – would depend on what you’re doing, but the YDEN could be used with a Pi to gather data directly into Signal K. Signal K supports various Yacht Devices devices (?) and their data streams so you could have the Signal K stuff running on a Pi consuming data that the YDEN is sending out. The PICAN board would be more “native” and probably more reliable in the long run, but you wouldn’t have to get one if you wanted to leverage your YDEN.
sunnycoastgreg
February 22, 2021 at 3:53 pm
steve, it might be worthwhile to some additional commentary about the influxdb plugin settings – in regards to the “batch write” & “resolution” parameters ..
(although in the standard influxdb setup, the retention policy is short (or maybe zero?)
so writing at the plugin default of 600ms will not create a db file size of any consequence..
Frank
April 14, 2021 at 7:20 pm
Hi, my Pi was running perfectly fine … until a few days ago. CPU load and RAM on influxdb went crazy and the average load through the roof. I didn’t change anything, just installed some updates, Pi and SignalK. But i’m not even sure it’s related.
Any idea where to start debugging? I disabled the influx writer plugin in SignalK, but made no difference.
Anybody else having similar issues?
Thanks!
- Steve Mitchell
July 17, 2021 at 1:38 pm
Sorry for not responding sooner – a bunch of comments got flagged as spam accidentally!
I’ve seen things get busy when a new input is added that logs at very high frequencies. You could reduce that if you think it’s related. I assume you’ve used top/htop and other tools to narrow down which process is going crazy?
Ray
May 2, 2021 at 8:33 am
Are you able to have audible alarms for things like battery voltage from a speaker connected to the server?
- Steve Mitchell
July 17, 2021 at 1:19 pm
It looks like there is a plugin for SignalK that produces audio alarms over a speaker: https://github.com/meri-imperiumi/signalk-audio-notifications#readme
You could probably setup alerts using one of the many methods, and have it use the speaker to notify you.
Scott C
May 2, 2021 at 4:21 pm
Steve et al,
Any experience with the RaspPi and SK having SD corruption or even ”hardening’ against SD corruption? I’ve used Pis on and off for a variety of projects, but inevitably, I corrupt them from a power outage or similar. Googling gets you a lot of noise and signal on the topic, was curious what the SK/database experience was out there.
- Steve Mitchell
July 17, 2021 at 12:56 pm
I’ve had a lot of RPi and haven’t had too much corruption, but I do tend to run them for long periods without shutting them down. There are newer SD cards that seem to do better, and if you are doing something massively disk-intensive, moving that to an external USB drive or something similar is probably a good idea.
There is a newer setup I’m investigating that has a supercapacitor involved that gracefully shuts the RPi down when power is lost. Beyond that, something that writes tons of data to it might be the next most likely issue. - Scott C
July 17, 2021 at 1:36 pm
I’m assuming you’re referring to this board/hat? I’m eyeing one as well.
https://hatlabs.fi/product/sh-rpi/?v=7516fd43adaa - Steve Mitchell
July 17, 2021 at 1:46 pm
Yup, that’s it. I have one with all of the options and am playing with it now.
Adam Hyde
May 9, 2021 at 11:27 pm
Steve, Thank you so much for writing this up (and other related articles), great guide to using the Pican-M with Signal K. I rushed out and bought one, have set it up on a Pi-4 along with Grafana, Influx and Node-Red. This is just an amazing combination. For simplicity I stuck an old iPhone with sim card in my boat to connect the Pi via wifi to the Internet. Installed Tailscale for the VPN, easy remote access via VNC. Been playing around with Node-red as a boat monitor and it works great. I am using the Pushover node in Node Red to send messages to my Iphone lock screen. I highly recommend Pushover and its various alert priorities as a way to receive push notifications instead of text messages which might be missed. The biggest challenge in all this is figuring out the math conversions of the obscure units that Signal K uses and which aren’t documented anywhere that I can find… e.g. propulsion.port.fuel.economy !
sunnycoastgreg
June 19, 2021 at 5:04 am
steve, some time ago (2yrs?) i followed a setup to get influxdb and grafana installed, however i cant find yr ealier post.
when i try to update grafana using the above “apt method” .. it tells me its installed v 8.0.3 ok… however my installation of grafana “as used” by signalk is stuck on V7.4.
(which has a huge known bug)
Q: there seems to be two different versions running on my pi/signalk installation.
i vaguely recall that yr earlier install method used a different way to install grafana?
no matter what i do it seems to always use the v7.4 ..
any clues on how to get rid of this? older version ?
- Steve Mitchell
July 15, 2021 at 10:50 am
It would really depend on the version of linux you’re using and the distribution options as well as the package manager. It could be if you installed grafana standalone and not through the package manager, or did something where a dependency is being enforced so that version is the one being used, etc. That’s more of an operating system/package manager issue it sounds like.
Ray
June 30, 2021 at 3:13 am
I followed this to install on a NUC running Ubuntu 20 and it’s all working pretty well. Three issue I’m seeing is that a couple of the gauges will show “No Data” every once in a while. If I wait for a few seconds for the Grafana dashboard to refresh is I manually refresh, if comes back. It repeats this throughout the day.
Have you seen anything like this?
- Steve Mitchell
July 3, 2021 at 9:08 am
It might be based on the data that is flowing into Grafana/Influx and how frequently that data is being updated. If you have the refresh rate set really high on the dashboard you have, it could be that in the last X amount of time there is no new updated value for that object. That’s the only thing I can think of off the top of my head.
JP Henderson
August 2, 2021 at 3:19 am
Good Monday morning Steve.
Firstly, thanks for the great articles on boat related electronics and projects.
We own a Selene trawler and I am in the process of ‘fleshing out’ a new N2K system and related monitors. A few months back, I followed your article on setting up an rpi with signalk, influxdb and graphana with great success. All ran well until I dorked up the system by removing power during an update and lost everything. I am now restoring the system but am running into a problem with infuxdb and I am hoping that you might have some insite. Influx install ok but the service will not start.
After the command ‘sudo service influxdb start’, the response I get is ‘Job for influxdb.service failed because the control process exited with error code.
See “systemctl status influxdb.service” and “journalctl -xe” for details.’
The infuxdb version is 1.8.7-1.
Any and all help would be greatly appreciated to get my system back up.
Thanks and take care.
JP Henderson
August 2, 2021 at 3:56 am
An update after some more research.
It appears that several users are having this issue after upgrading to 1.8.7-1.
Using: sudo chmod +x /usr/lib/influxdb/scripts/influxd-systemd-start.sh
fixes the issue (bug?).
Thanks again
Archived Community Comments
These comments were posted on the SeaBits forum before February 2026. Scroll down to join the current discussion.
Thanks for the great article! I’ve got everything hooked up, but I notice on restart that can0 isn’t coming up properly. I used journalctl -u socketcan-interface.service -b to take a look, and this is the error I’m getting
Mar 12 13:34:12 raspberrypi systemd[1]: Starting SocketCAN interface can0 with a baudrate of 250000...
Mar 12 13:34:12 raspberrypi ip[436]: Cannot find device "can0"
Mar 12 13:34:12 raspberrypi systemd[1]: socketcan-interface.service: Main process exited, code=exited, status=1/FAILURE
Mar 12 13:34:12 raspberrypi systemd[1]: socketcan-interface.service: Failed with result 'exit-code'.
Mar 12 13:34:12 raspberrypi systemd[1]: Failed to start SocketCAN interface can0 with a baudrate of 250000.
Any idea what is going on there?
It’s been a lot of fun playing around with the data. Thanks for the step by step instructions of getting it set up!
Hmmm seems like the interface isn’t there at boot up, or maybe at the particular time it is being started/searched for. Can you manually start things afterwards, or does it just not work at all after boot up?
I’m guessing this might be an ordering thing…
I can manually start up the interface with sudo /sbin/ip link set can0 up type can bitrate 250000 and then the data starts flowing in. I tried manually running the commands contained in the .services file, but got errors like “device or port already in use”.
I found some instructions on the board’s site that said to add
auto can0
iface can0 inet manual
 pre-up /sbin/ip link set can0 type can bitrate 250000
 up /sbin/ifconfig can0 up
 down /sbin/ifconfig can0 down
to /etc/network/interfaces, and that seems to work nicely.
I’ve just gotten home, so I’ll remove the /etc/network/interfaces changes and go back to the services approach and see if I can reproduce the error.
It’s been a long time since I’ve mucked around with linux. What info would be useful for you to have?
Instead of copy and pasting, I tried manually typing the file contents (in case a weird white space character was appearing). I also only included the first line -
ExecStart=/sbin/ip link set can0 type can bitrate 250000 ; /sbin/ifconfig can0 up
That worked on first reboot, but has failed on every subsequent reboot.
If I run
sudo systemctl start socketcan-interface.service
the socket starts up just fine.
I think you are right that there is an ordering issue. I’m just not sure where to start looking.
Love the article. Just ordered a PICAN-M board!
I also suggest you have a look at Signal K’s KIP plugin. Probably the most useable dashboard and it works with most if not all browsers.
Very odd. Definitely seems like an ordering issue. What version of the base operating system are you using? I’m wondering if something changed there that could have caused this.
KIP is great and I’ve used it for a long time. A good dashboard if you want something lightweight that is basically quick to install directly into Signal K and doesn’t require other software.
Sorry Steve, I missed this message.
pi@raspberrypi:~ $ cat /etc/os-release
PRETTY_NAME="Raspbian GNU/Linux 11 (bullseye)"
NAME="Raspbian GNU/Linux"
VERSION_ID="11"
VERSION="11 (bullseye)"
VERSION_CODENAME=bullseye
ID=raspbian
ID_LIKE=debian
HOME_URL="http://www.raspbian.org/"
SUPPORT_URL="http://www.raspbian.org/RaspbianForums"
BUG_REPORT_URL="http://www.raspbian.org/RaspbianBugs"
hello, I was curious if you could offer advice on connecting my pi running signalk as configured in your article, to an ikommunicate device on the same network. My Pi running signalk is 192.168.10.13 and my ikommunicate gateway is at 192.168.10.22. I can log into both devices but they wont connect. I added a “data connection” with, websockets and 192.168.10.22 and port 80, but i get no deltas coming in
I’m not sure why it wouldn’t work, but it could be that the older version of SignalK on the iKommunicate isn’t sending the right data. I am not sure if they have kept up with the newer versions of SignalK - might be worth checking on the versions and with Digital Yachts.
Yeah, i think that’s it. Probably my bad for buying the darn thing when the last firmware was 2018. I just ordered a pican. Seems like a better solution anyway.
Brian
So, the pican-m works exactly as it should. Easy peasy. Digital Yachts is basically incommunicado. I’ve emailed and reached out via instagram as an alternative. Silence. I dug out a connection deprecated error so I assume that ikommunicate no longer works with signalk. Firmware was last updated in 2018 so i guess that’s no surprise. I’m happy that my system works, but annoyed at wasting 300$ on a not viable device. Totally my bad, but you might want to add a note on your ikommunicate review that it seems to no longer be a supported device.
Thanks for the note about the iKommunicate. When did you buy yours? I will definitely add a note to the article.
Bought it direct from http://ikommunicate.com/ in January.
B
Thanks! I’ve posted a note at the top of the article so others don’t go down this route.
Hopefully Digital Yachts will get back to you - they’re pretty responsive when I’ve communicated with them.
This guide has been super useful – thank you! As I’ve rebuilt my pi 3x now (trying various things out), it’s gotten a lot of use. But, an important note – grafana 8.5 does not currently work on a pi (see Server start failure after 8.5.0 upgrade - #7 by ebouxirot - Installation - Grafana Labs Community Forums) so instead of:
sudo apt-get install -y grafana
you need to do:
sudo apt-get install -y grafana=8.4.7
(it may be fixed by the time anyone reads this, so check the issue in github)
Unfortunately, it appears as though the ikommunicate will not be updated. After one of their engineers working on the ikommunicate left, they basically froze the product. So word is it will now basically sit as a stand alone gateway that you can connect to directly, but the device will not be able to communicate with a Pi running signalk now or in the foreseeable future.
Ah that’s too bad, but at least you know now. Did they offer any sort of refund or anything around that?
They’ve been pleasant about the whole thing and have offered to swap me to a wifi one or ethernet one. I also asked if they’d open source the firmware. Would be an interesting way to not have a product die.
Brian
Hi
Thank you for the instructions. Works immediately.
I connected an I2C sensor at the PICAN M. How do I get this data on Signal K?
Run over the can0?
Thanks.
Your question is likely a bit more advanced. I would look into Signal K documentation and perhaps join their Slack channel and investigate getting data into the system from your sensor. There are also a lot of plugins for Signal K that could address this already.
Steve, Thank you for the awesome instructions. Hitting two errors…
Signal K and Pican-M are connected and sending data. I am trying to setup the DB and hit the following:
-
the first is during the apt-key add. I get Warning: apt-key is deprecated. Manage keyring files in trusted.gpg.d instead (see apt-key(8)).
-
I can’t find grafana
sudo apt-get install -y grafana
Reading package lists… Done
Building dependency tree… Done
Reading state information… Done
E: Unable to locate package grafana
Thanks
What version of operating system are you using? It sounds like you might have a newer version or that they’ve changed something.
I think this is related to #1 if you’re not able to add the repository and key for grafana, you can’t install it.
Steve, Thanks for getting back to me.
I am running Debian Bullseye Lite (64 bit), which is the April 4th 2022 release. I was able install using the instructions located in the PiMyLifeup link using gpg for Grfana and InfluxDB.
I do now have InfluxDB and Grafana setup and working…
Setting up a VPN to retrieve settings and build dashboards from home next!
Hi. Did anyone sort out this issue? I’m setting up a new system and having the same problem. On boot, the ExecStart command fails. But after things come up I can start the service and it works. Seems like there is a missing dependency someplace.
Hey Steve,
It’s been a while since I played with it, but I think there was an update to the base operating system of the Pi operating system that caused this. I think I was able to get it working by following the instructions from here: PiCAN-M with CAN-Bus Micro-C and RS422 Connector + 3A SMPS — SK Pang Electronics Ltd
sudo nano /etc/network/interfaces
...
auto can0
iface can0 inet manual
pre-up /sbin/ip link set can0 type can bitrate 250000 up /sbin/ifconfig can0 up
down /sbin/ifconfig can0 down
Let me know if that works!
Just tried it. It didn’t help. I did add a “sleep 5” to the socketcan-interface.service files ExecStart line and that seems to work.
Wish I new what it needs to wait for.
Steve,
first off many thanks for your inspiring work. I followed the protocol you describe in the article, and successfully got all the info from my Seatalk1/SeatalkNG instruments over to the raspberry pi4b with PICAN-M board, running signalK within OpenPlotter, and residing at the nav station (Bavaria 37 Cruiser).
I have PICAN-M HAT powered from the SeaTalkNG. Only now I realised that having a separate power supply for the raspberry pi would be better. The tech support person from SK Pang electronics claims that powering raspberry pi via the USB is ok even if the NMEA2000 network is connected to the PICAN-M.
I vaguely remember that someone here installed a NMEA2000 power insulator to preclude the voltage from the network onto PICAN-M. What do you think?
Regards
Thank you for digging into this. I’ve considered reusing the ikumunicate which I bought while it was in kickstarter as an anchor. But it’s too lightweight even in that use case. Rest in peace.