There are two main ways to troubleshoot a NMEA 2000 network – hardware and software. Most people should start with a hardware method to ensure the basic electrical properties of their network are sound. Software is more complex and expensive, but can help diagnose device configuration issues.
NMEA 2000 Basics
NMEA 2000 networks are electrically similar to a Controller Area Network (CAN) bus network which can be found on cars and trucks. CAN was released in 1986 with NMEA 2000 coming in the late 1990s, so it is already nearly 20 years old, and based on 30+ year old technology. It’s not the best network in the world, and has a lot of drawbacks and issues, but it is the standard we have to deal with for now.
The bigger challenge in troubleshooting data on the network is actually the body that governs it – NMEA. From Wikipedia:
“NMEA divulges some information regarding the standard, it claims copyright over the standard and thus its full contents are not publicly available. For example, the NMEA publicizes which messages exist and which fields they contain, but they do not disclose how to interpret the values contained in those fields.“
This makes it very hard to troubleshoot things without paying for an interface or product that is certified and understands all of the data on the network. In almost all cases, there will be data on an N2K network that another manufacturer’s tool won’t even understand and shows up as proprietary. Lots of folks have figured out the data in a PGN and helped document things that NMEA refuses to make public. I think it is unfortunate that NMEA has this policy of not sharing this information. It would not only make troubleshooting easier, but it would most likely increase the amount of people and devices using NMEA 2000 networks.
I’m not suggesting that every random DIY’er like myself should be allowed to create and connect devices without being certified, as that could definitely be a problem. Someone spitting data onto an N2K network without having it be tested and certified could be dangerous, especially if it messed with navigational data you rely on. However, there has to be a middle ground where end users can see the data reasonably. I’m not holding my breath though, as this battle has been ongoing since NMEA 2000 came out….
I think NMEA 2000’s days are numbered with the need for higher data rates and modern protocols. Newer versions of products are already starting to use Ethernet, WiFi and other methods, so perhaps we won’t be talking about this in 5 years. But for now, NMEA 2000 is still the standard and will continue to be for a while.
NMEA 2000 Data
Wikipedia has a good description of how data messages move back and forth on a NMEA 2000 network:
NMEA 2000 messages are sent as packets that consist of a header followed by (typically) 8 bytes of data. The header for a message specifies the transmitting device, the device to which the message was sent (which may be all devices), the message priority, and the PGN (Parameter Group Number). The PGN indicates which message is being sent, and thus how the data bytes should be interpreted to determine the values of the data fields that the message contains.
We will be looking at PGNs when using software troubleshooting tools below.
Methodology
More than any of the hardware, tools or software below, having a logical methodology is an essential part of troubleshooting a NMEA 2000 network. I firmly believe this is important with any kind of troubleshooting, having spent the majority of my life working on electrical, mechanical, and networking devices.
For NMEA 2000 networks, I recommend adopting one really simple mantra: make one change at a time, and document what you change. Making too many changes at once usually causes new problems, some of which you would never see in the real world. Writing down what you changed, in what order you changed it is also helpful. Once you’re able to reproduce or figure out the issue, the series of steps you took may be the key in identifying what is wrong.
One of the best ways to troubleshoot an N2K network is to use the following basic steps:
- Power down the NMEA 2000 network and all attached devices.
- Power up everything one at a time until the problem starts. Write down what you powered up and in what order. Usually the last device is the culprit.
In addition, for really finicky issues, physically unplugging all devices from the N2K network and adding each one back will let you narrow it down to a particular device.
Whatever you do, do one thing at a time, and document as much as you can. For intermittent issues, see the tools below.
Hardware
DIY
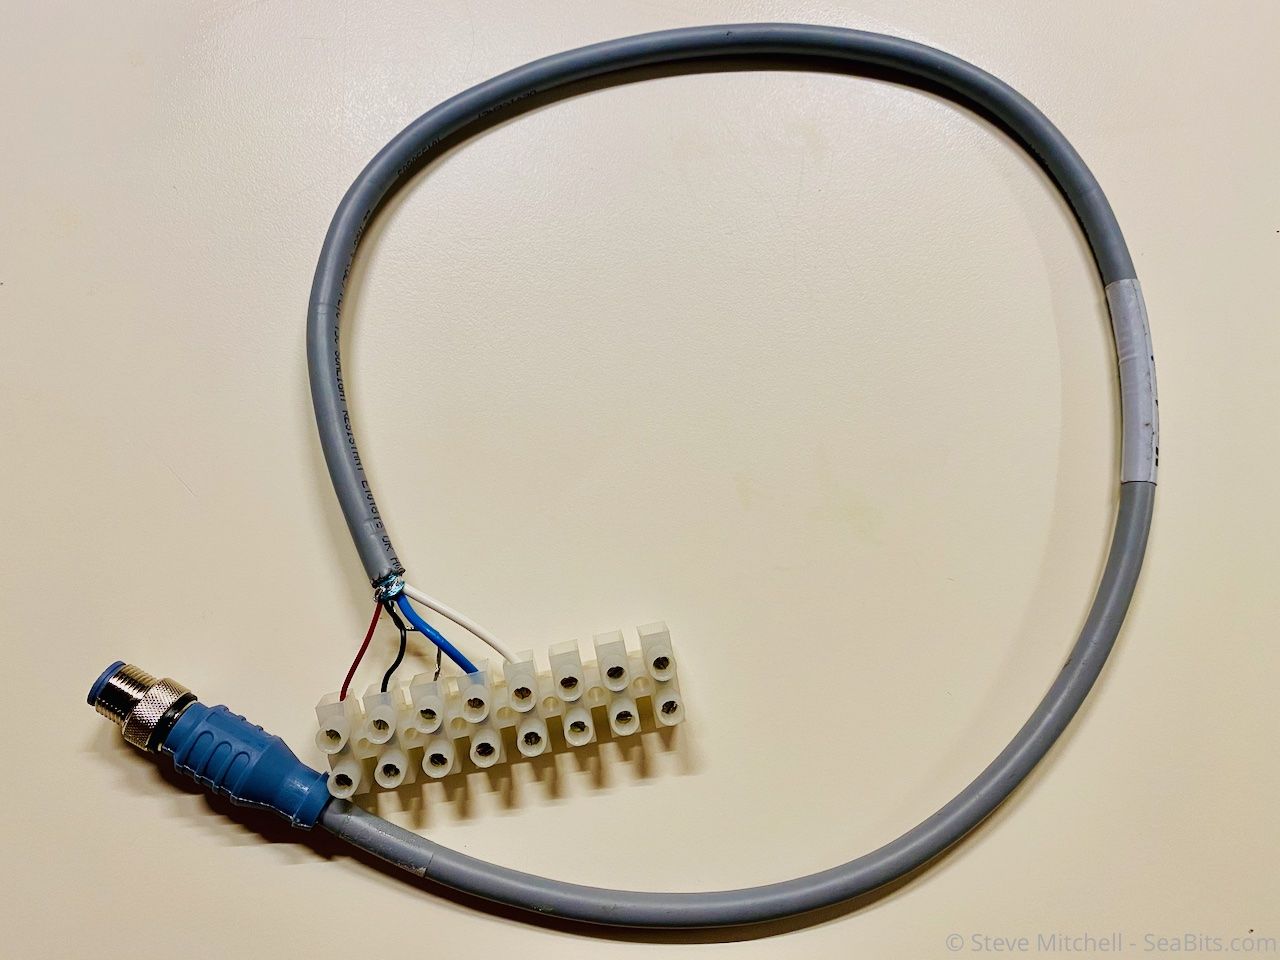
The easiest way to troubleshoot the physical electrical properties of your N2K network is with a multimeter and half of a NMEA 2000 drop cable.
Maretron has a good step-by-step guide on what to test which I usually refer to when I forget – How do I check the health of my NMEA 2000 cabling before powering my network?
It’s important to perform the testing with the right conditions – some tests are with power on and devices connected, some without devices connected, and some without power at all. The most common issues I’ve seen with my network and others are:
- Bad / missing terminators
- Wires crossed / grounded wrong – usually happens when using your own N2K ends and wires end up touching or are not wired correctly.
- Voltage issues
Also, make sure not to skip steps – test every tee, drop cable, and location. Just because it looks good at one location doesn’t mean that the voltage doesn’t drop somewhere else, or that you don’t have a crossed wire further down the line.
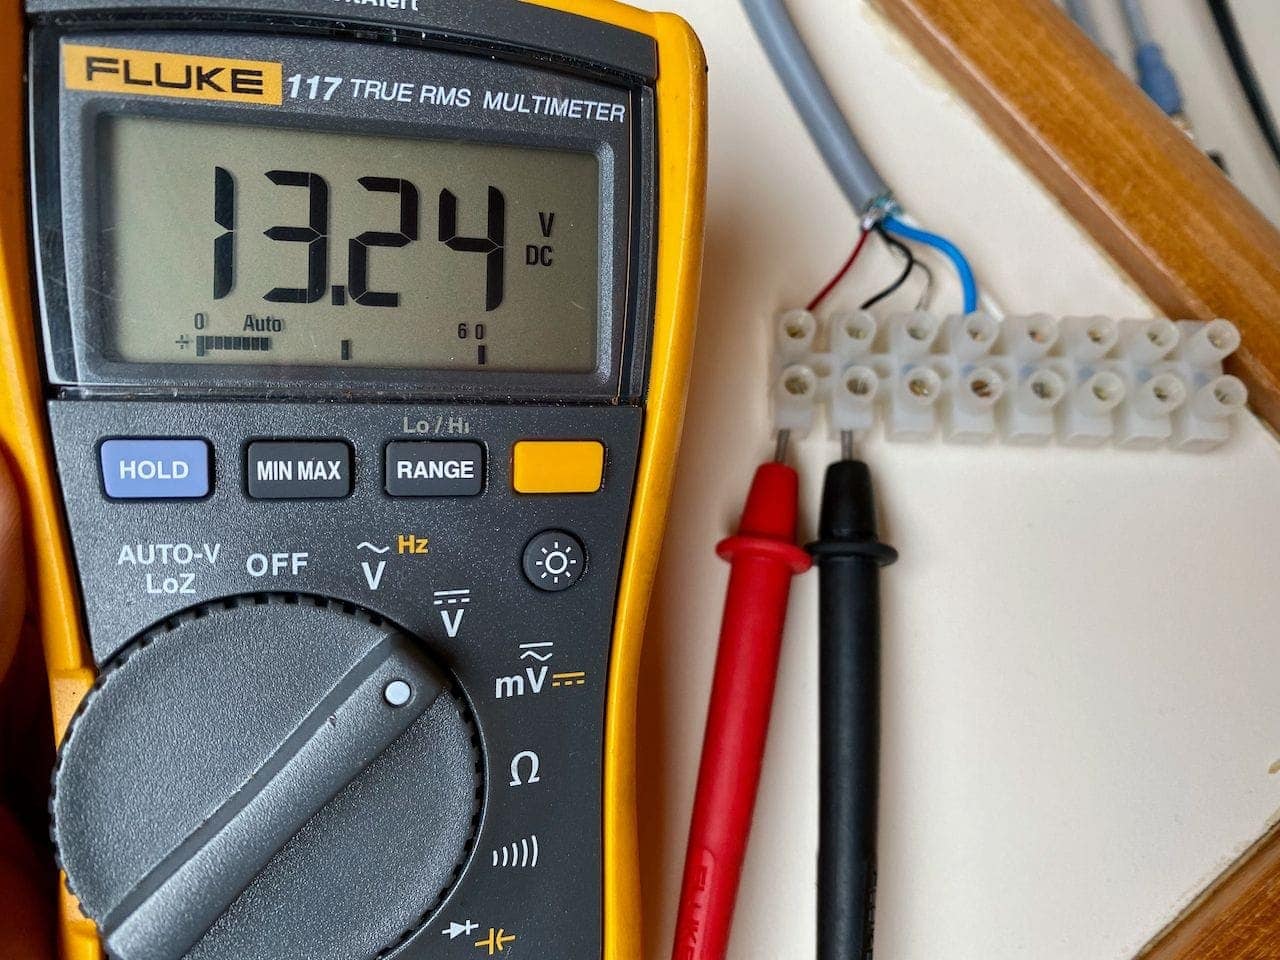
My test cable above is setup to allow the test probes from my multimeter to be held into the connecting points a bit so that I can move things around and test various drop cables, tees, and locations without things slipping out.
This is the primary easy tool I start with when troubleshooting any NMEA 2000 issue.
Professional / Expensive
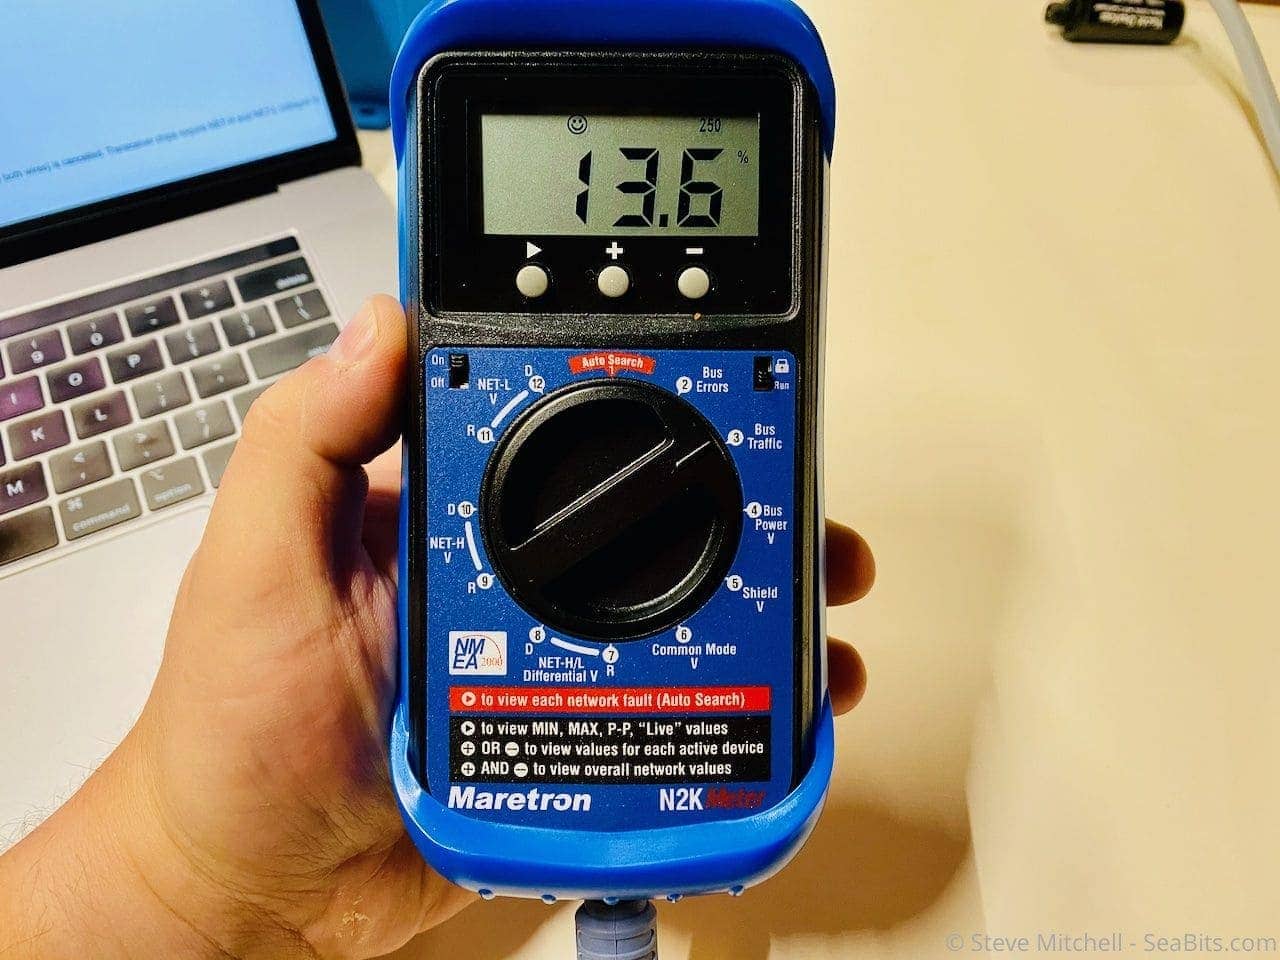
If you are a super N2K nerd like me, you will want the Maretron N2K meter which is a pricey hardware device that takes testing to a new level. It can test what the DIY version does (voltage, termination, etc.) plus a lot more including:
- Opens and shorts
- Incorrect topology
- Bad nodes
- Improper shield connection
- Intermittent problems
- Excessive scan rate
- Common mode voltage
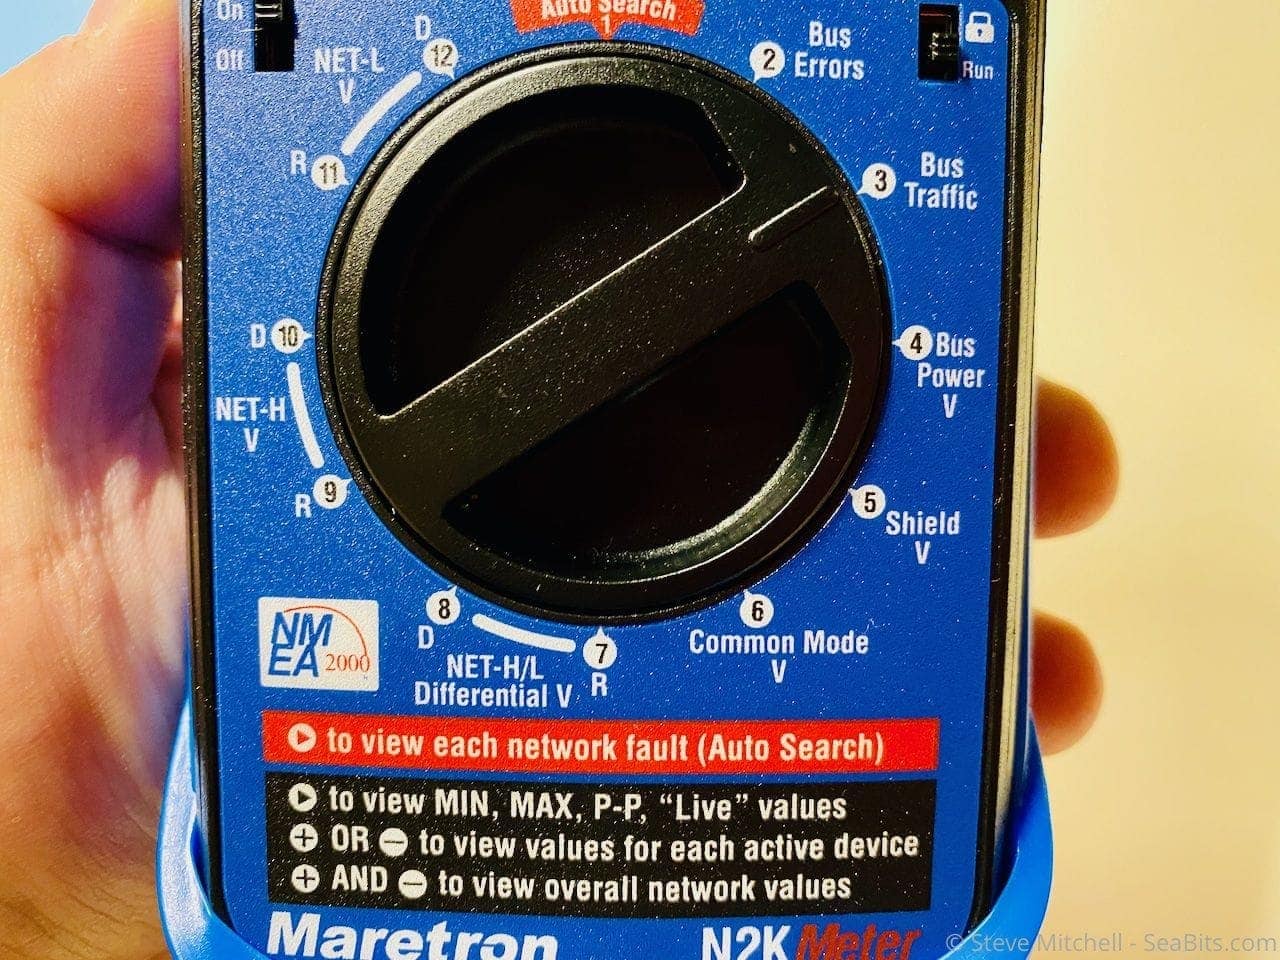
It’s quite expensive, so unless you have an extensive network that you change a lot, I doubt many people would purchase this. However, for someone who does mess with their N2K network a lot, this is a lifesaver. You can set it in Auto Search mode, which cycles through all of the tests and displays only the ones that are failing, or step through each test individually.
Depending on the problem I’m trying to solve, I’ll use a bit of both. In many cases, tracking down an intermittent problem is best found by leaving it on auto search so that whatever is happening is caught at least once over a period of time. Then you can flip it to that specific test and gather more data for a longer time, even step through data about individual connected devices, and a lot more for such a simple looking tool.
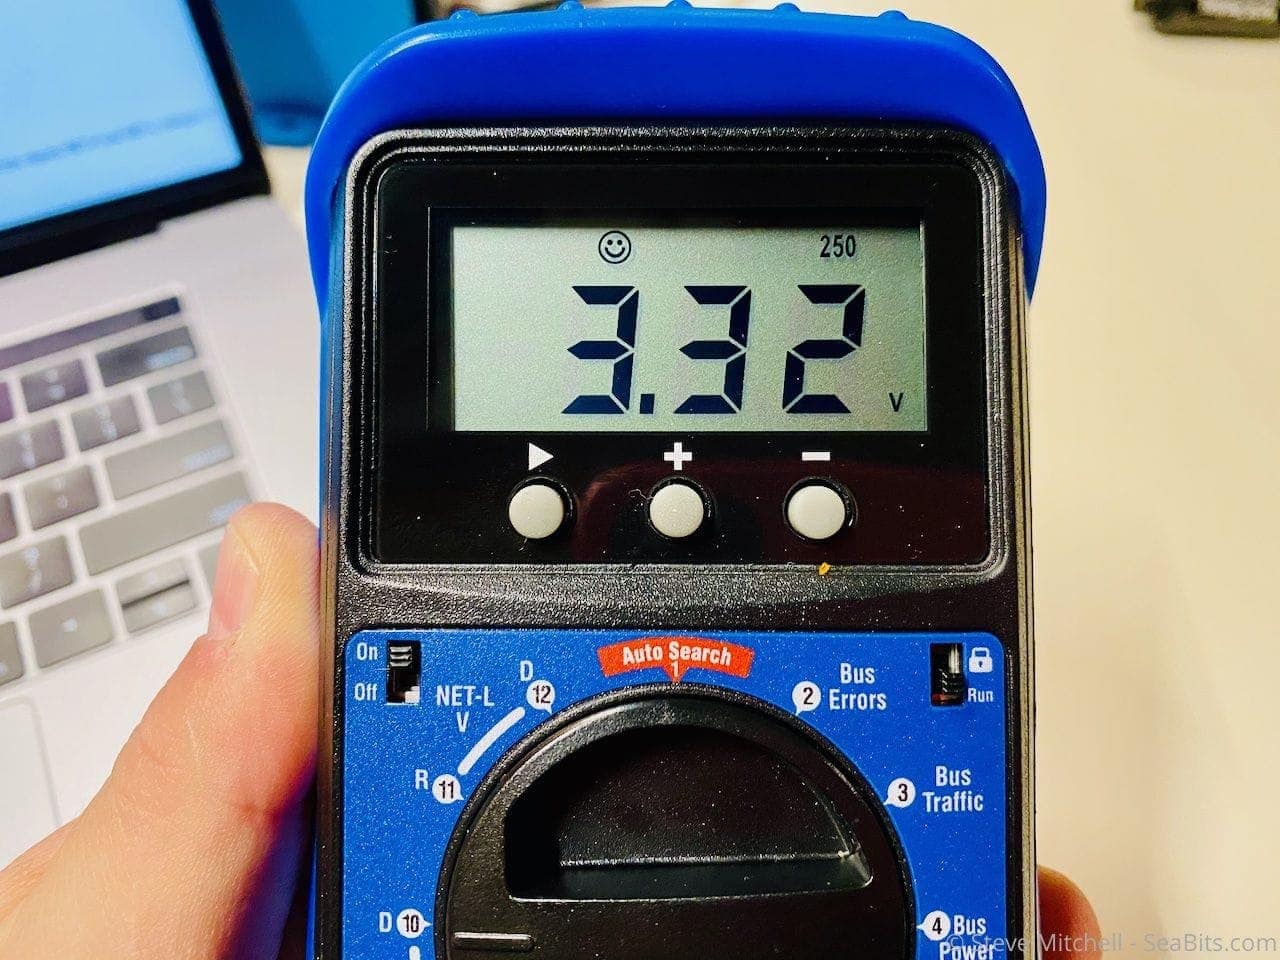
If things are working well, you get a nice happy face at the top of the display, and the data for the particular test.
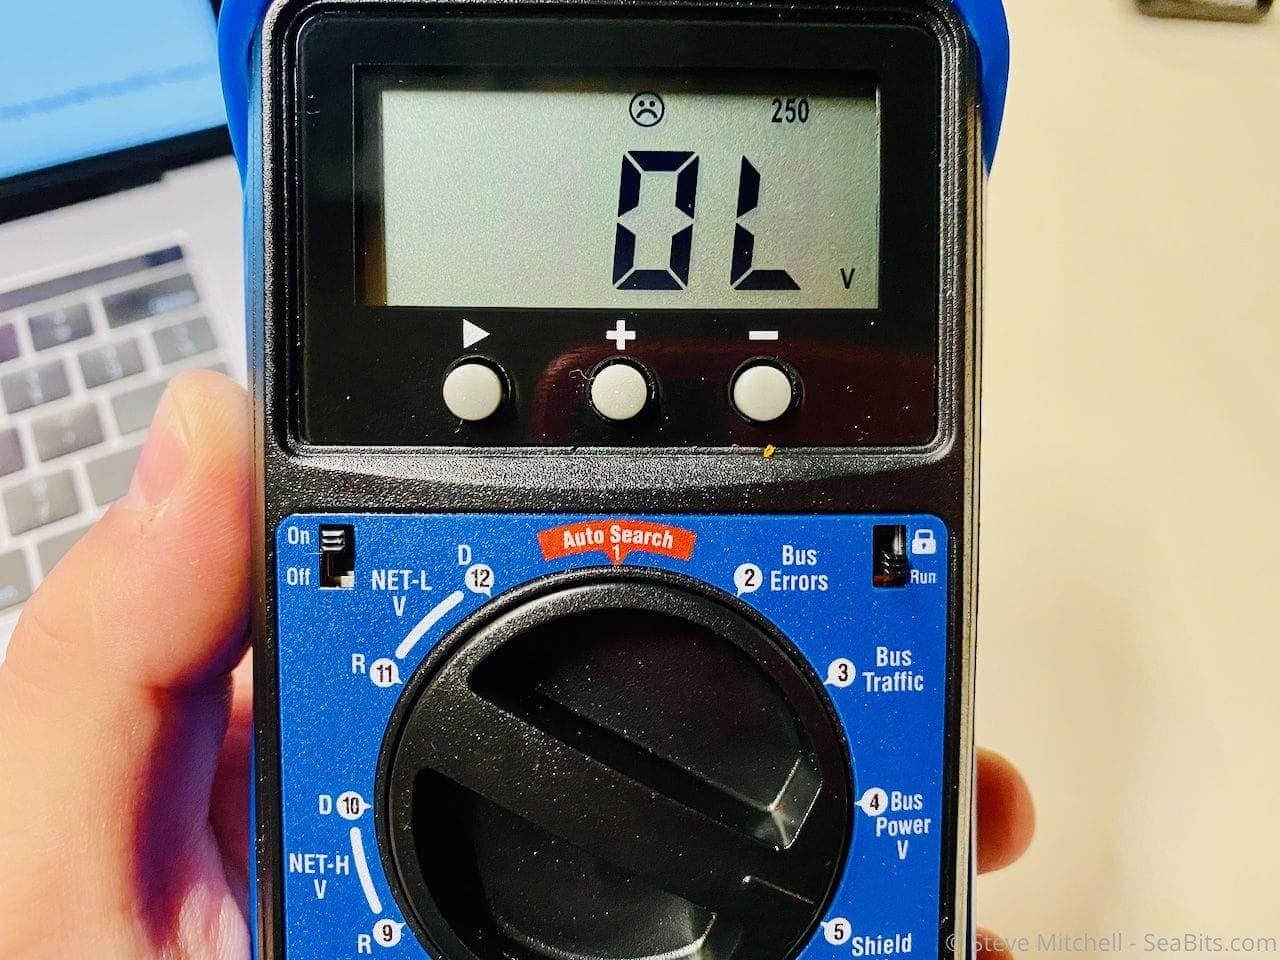
When something isn’t within the tests good parameters, you get either an indifferent or sad face, depending on how bad it is. A very quick way to tell that something is not working well.
This is a fantastic tool to use on any NMEA 2000 network if you have it. It provides the most information I’ve ever found for the physical and electrical properties of a network, and allows you to do realtime monitoring to trace down harder to find issues.
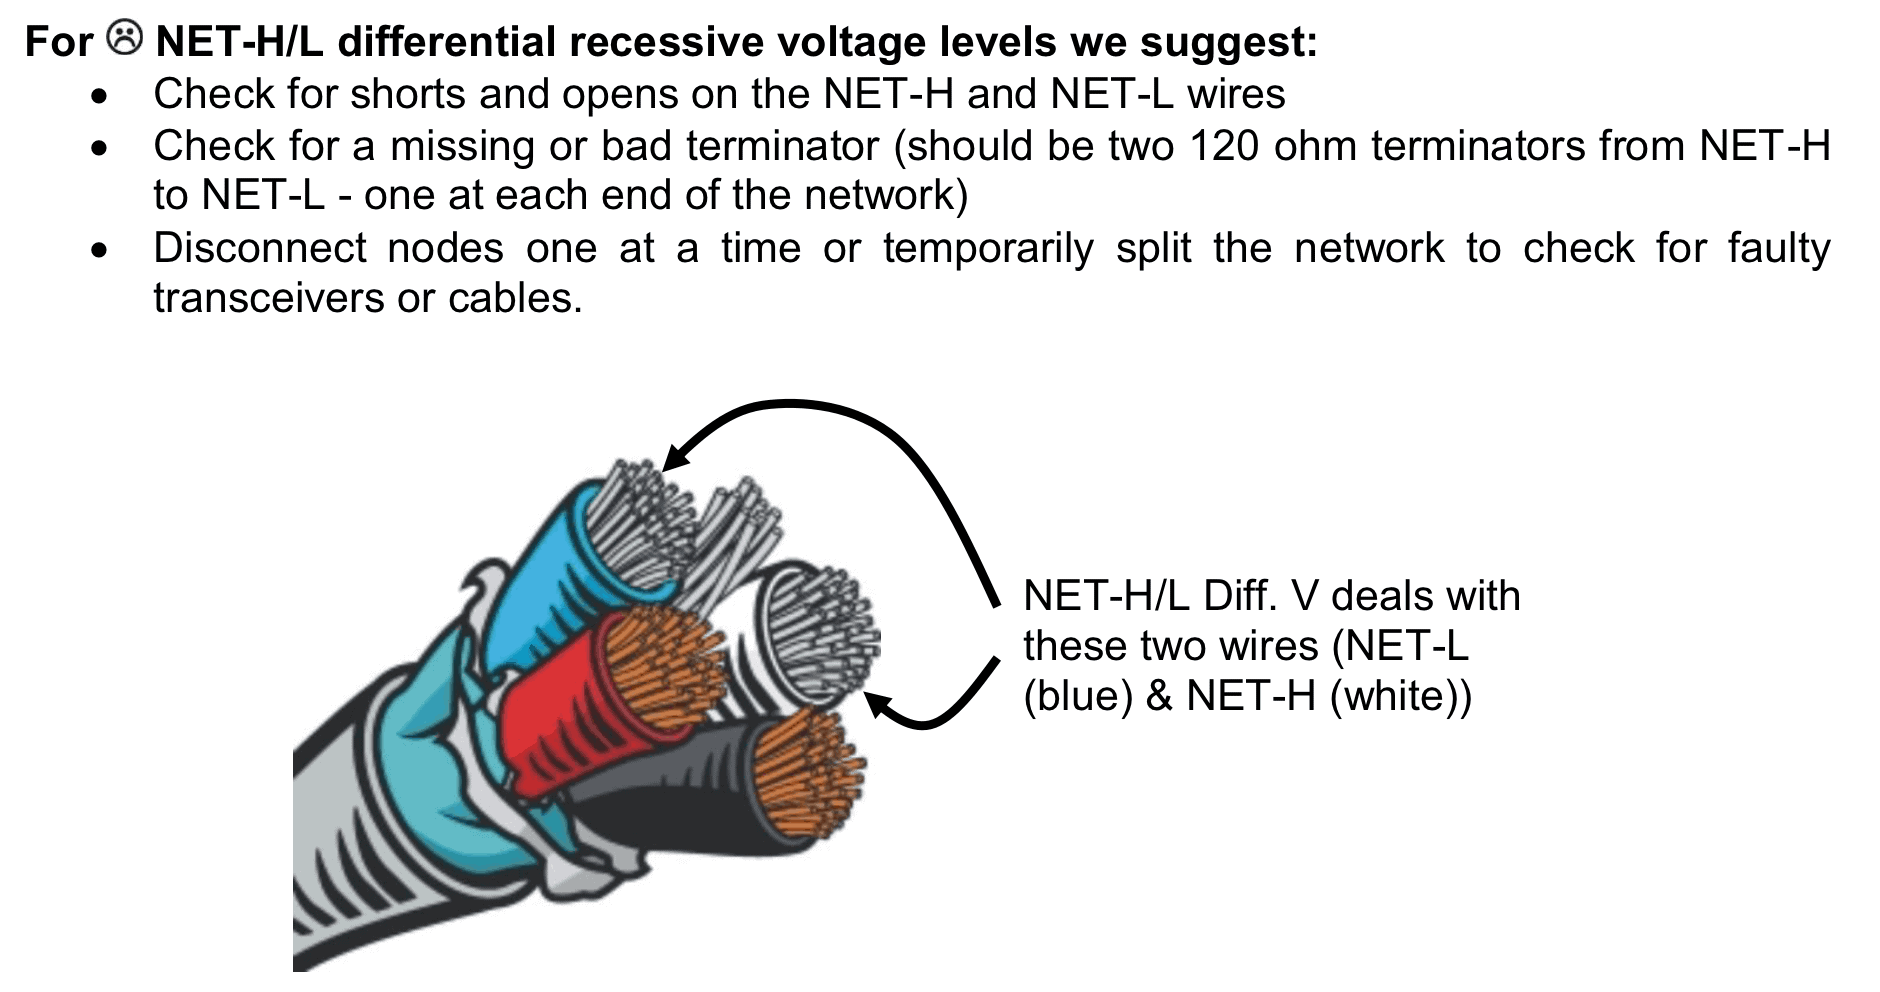
There is also a phenomenal manual that Maretron have written to accompany the device. It explains each test and why they’re important, what is good/bad/pass/fail and even diagrams the cable and reasons why in great detail. This is a good reference even without the N2K tester in case you are tracing down issues.
I love my N2K tester and use this combined with at least one software solution when I’m troubleshooting N2K issues. If you’re in the Seattle area and have an N2K network you want to have tested, I’m always interested in seeing new things and happy to stop by with the tester!
Software
DIY – canboat / canable
A cheap way to see what is on an N2K network is a canable.io interface + canboat software on a Linux machine. It doesn’t have a graphical interface, however, and can be challenging to find patterns due to the sheer amount of data you can capture. It can be useful to capture the data and send off to others to review.
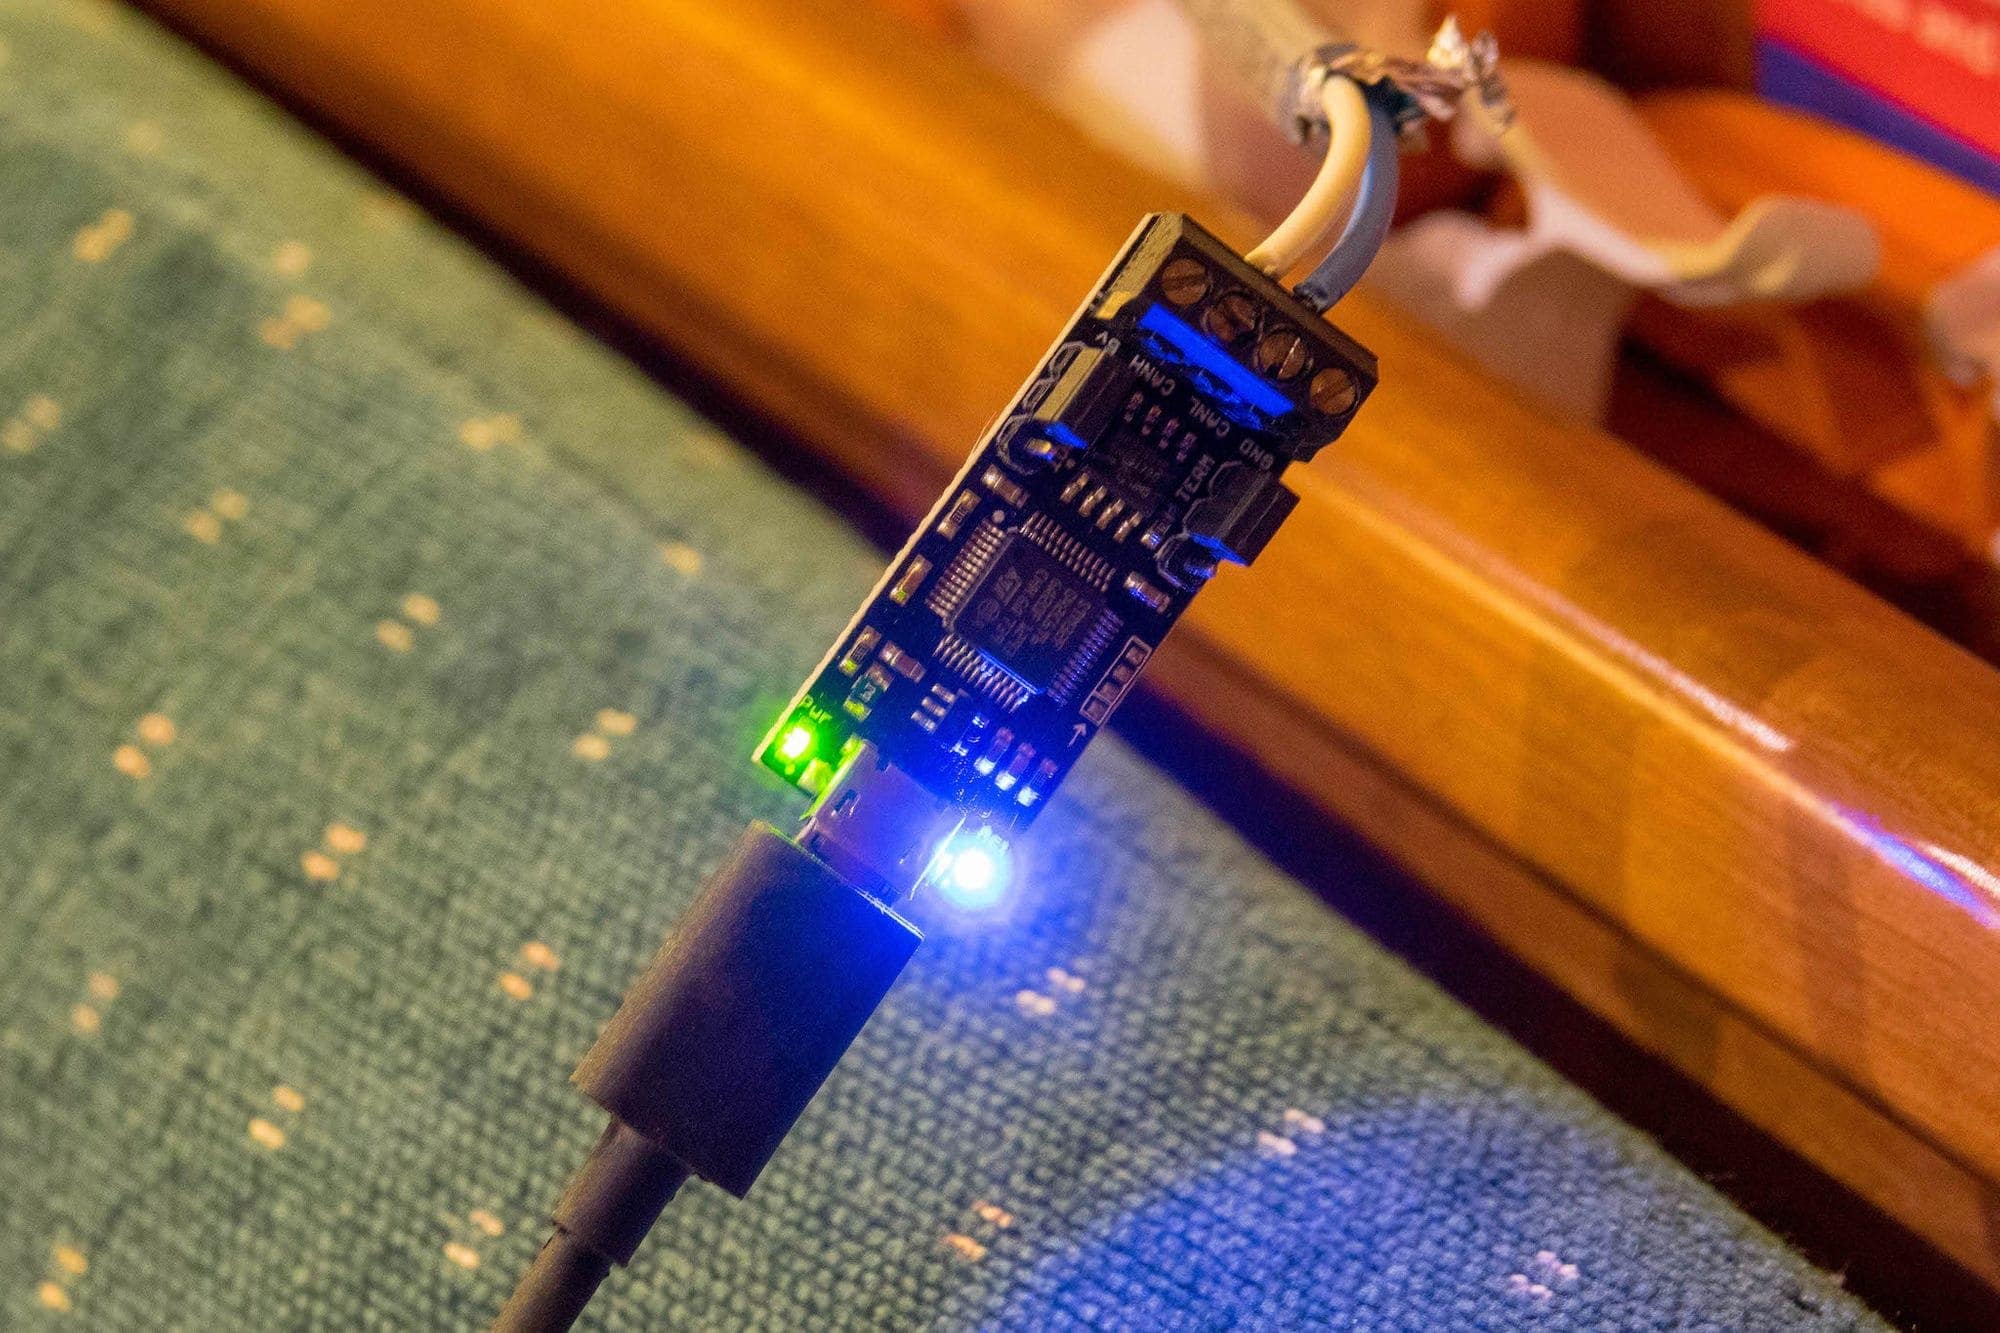
I have had better luck using the alternative firmware which makes the canable show up as a native CAN device in more modern Linux kernels. You do have to setup the CAN device correctly with the right bus speed:
ip link set can0 up type can bitrate 250000
Once you have the canable configured and connected to your N2K network, it’s time to install canboat. Canboat has been around a long time, and has a great wiki with info on how to install and use it.
There are two main parts to canboat – the part that reads the data off of the N2K network, and the part that parses the data and displays it in human readable form. If you’re using a canable device, you won’t use the first part, as there will be a native CAN device (usually can0) that you can point canboat to, and things will just work.
If you’re using an Actisense NGT device (see below) then you’ll need actisense-serial to connect to it and read the N2K network.
2019-12-15T18:40:49.434Z,0,262386,0,0,33,01,0e,00,5b,a0,03,00,00,00,00,00,02,12,02,00,00,00,00,00,00,00,00,2b,5e,02,0a,00,00,00,0f,00,00,00
2019-12-15T18:40:49.434Z,2,127250,3,255,8,ff,a1,ae,ff,7f,ff,7f,fd
2019-12-15T18:40:49.434Z,2,127250,36,255,8,c3,98,ba,00,00,f9,0a,fd
2019-12-15T18:40:49.434Z,2,127250,0,255,8,ff,a1,ae,ff,7f,ff,7f,fd
2019-12-15T18:40:49.434Z,2,129025,0,255,8,b9,83,63,1c,68,fd,0b,b7
2019-12-15T18:40:49.434Z,4,129038,43,255,28,01,22,dd,e0,15,eb,e2,11,b7,3e,13,5b,1c,c4,37,c1,00,00,24,41,09,ff,ff,ff,7f,c0,f8,ff
2019-12-15T18:40:49.434Z,2,127250,3,255,8,ff,a1,ae,ff,7f,ff,7f,fd
2019-12-15T18:40:49.434Z,3,126992,43,255,8,4b,f0,45,47,10,62,15,28
2019-12-15T18:40:49.434Z,2,129025,43,255,8,78,80,63,1c,68,fd,0b,b7
2019-12-15T18:40:49.434Z,2,129026,43,255,8,4b,ff,ff,ff,01,00,ff,ff
2019-12-15T18:40:49.434Z,2,127250,36,255,8,c4,98,ba,00,00,f9,0a,fd
2019-12-15T18:40:49.464Z,2,127250,3,255,8,ff,a2,ae,ff,7f,ff,7f,fd
2019-12-15T18:40:49.464Z,7,65284,3,255,8,3f,9f,00,00,64,00,ff,ff
2019-12-15T18:40:49.464Z,2,127250,36,255,8,c5,98,ba,00,00,f9,0a,fd
Above is an example of the raw frames from an N2K network. This can still be useful to review, as seeing funky data in here could indicate an issue with a device, etc. depending on what is showing up.
2019-12-15T18:42:38.933Z 2  36 255 129025 Position, Rapid Update:  Latitude = 47.6283933; Longitude = -122.3950816
2019-12-15T18:42:38.933Z 2  36 255 129026 COG & SOG, Rapid Update:  SID = 49; COG Reference = True; COG = 318.8 deg; SOG = 0.00 m/s
2019-12-15T18:42:38.933Z 2  36 255 127250 Vessel Heading:  SID = 243; Heading = 273.7 deg; Deviation = 0.0 deg; Variation = 16.1 deg; Reference = Magnetic
2019-12-15T18:42:38.933Z 2   0 255 127250 Vessel Heading:  SID = Unknown; Heading = 256.2 deg; Deviation = Unknown; Variation = Unknown; Reference = Magnetic
2019-12-15T18:42:38.933Z 2   0 255 129025 Position, Rapid Update:  Latitude = 47.6283933; Longitude = -122.3950816
2019-12-15T18:42:38.933Z 2   3 255 127250 Vessel Heading:  SID = Unknown; Heading = 256.2 deg; Deviation = Unknown; Variation = Unknown; Reference = Magnetic
2019-12-15T18:42:38.933Z 4  43 255 129038 AIS Class A Position Report:  Message ID = 3; Repeat Indicator = Initial; User ID = 366759130; Longitude = -122.3494815; Latitude = 47.6006550; Position Accuracy = Low; RAIM = not in use; Time Stamp = 38; COG = 255.8 deg; SOG = 7.45 m/s; Communication State = 0x1eb1; AIS Transceiver information = Channel A VDL reception; Heading = 255.0 deg; Rate of Turn = 0.00 deg/s; Nav Status = Unknown; Regional Application = 0
2019-12-15T18:42:38.933Z 2  36 255 127250 Vessel Heading:  SID = 244; Heading = 273.7 deg; Deviation = 0.0 deg; Variation = 16.1 deg; Reference = Magnetic
2019-12-15T18:42:38.933Z 2  43 255 129025 Position, Rapid Update:  Latitude = 47.6283000; Longitude = -122.3951000
2019-12-15T18:42:38.933Z 2   3 255 127250 Vessel Heading:  SID = Unknown; Heading = 256.2 deg; Deviation = Unknown; Variation = Unknown; Reference = Magnetic
2019-12-15T18:42:38.933Z 2  36 255 127250 Vessel Heading:  SID = 245; Heading = 273.7 deg; Deviation = 0.0 deg; Variation = 16.1 deg; Reference = Magnetic
2019-12-15T18:42:38.933Z 4  43 255 129038 AIS Class A Position Report:  Message ID = 1; Repeat Indicator = Initial; User ID = 366764080; Longitude = -122.3789765; Latitude = 47.6589300; Position Accuracy = Low; RAIM = not in use; Time Stamp = 37; COG = 253.3 deg; SOG = 0.00 m/s; Communication State = 0x1c148; AIS Transceiver information = Channel A VDL reception; Heading = Unknown; Rate of Turn = Unknown; Nav Status = Under way using engine; Regional Application = 0
Taking the raw data and using canboat’s analyzer produces a human readable result like above. However, it is a lot of data, and requires that you look through things to find any patterns.
I took a sample from my network over a 30 second period and ended up with 7,624 messages. Most of those are fast updates for things like heading and such, but still overwhelming if you are trying to look for one particular issue.
2019-12-15T18:45:57.978Z 6  88 255 127505 Fluid Level:  Instance = 0; Type = Fuel; Level = 50.956 %; Capacity = 1135.6 L
2019-12-15T18:45:57.978Z 6  88 255 127505 Fluid Level:  Instance = 1; Type = Water; Level = 65.264 %; Capacity = 567.8 L
2019-12-15T18:46:00.457Z 6  88 255 127505 Fluid Level:  Instance = 0; Type = Fuel; Level = 50.956 %; Capacity = 1135.6 L
2019-12-15T18:46:00.457Z 6  88 255 127505 Fluid Level:  Instance = 1; Type = Water; Level = 65.264 %; Capacity = 567.8 L
2019-12-15T18:46:02.958Z 6  88 255 127505 Fluid Level:  Instance = 0; Type = Fuel; Level = 50.956 %; Capacity = 1135.6 L
2019-12-15T18:46:02.958Z 6  88 255 127505 Fluid Level:  Instance = 1; Type = Water; Level = 65.264 %; Capacity = 567.8 L
2019-12-15T18:46:05.443Z 6  88 255 127505 Fluid Level:  Instance = 0; Type = Fuel; Level = 50.956 %; Capacity = 1135.6 L
2019-12-15T18:46:05.443Z 6  88 255 127505 Fluid Level:  Instance = 1; Type = Water; Level = 65.264 %; Capacity = 567.8 L
canboat does allow you to filter for one particular PGN – above I’m using the following command to just look for the fluid PGN, 127505:
analyzer 127505 < slow.capCanboat with a canable or NGT interface are a good way to start debugging NMEA networks, but if you want something more visual, see below.
Professional / Expensive
Maretron
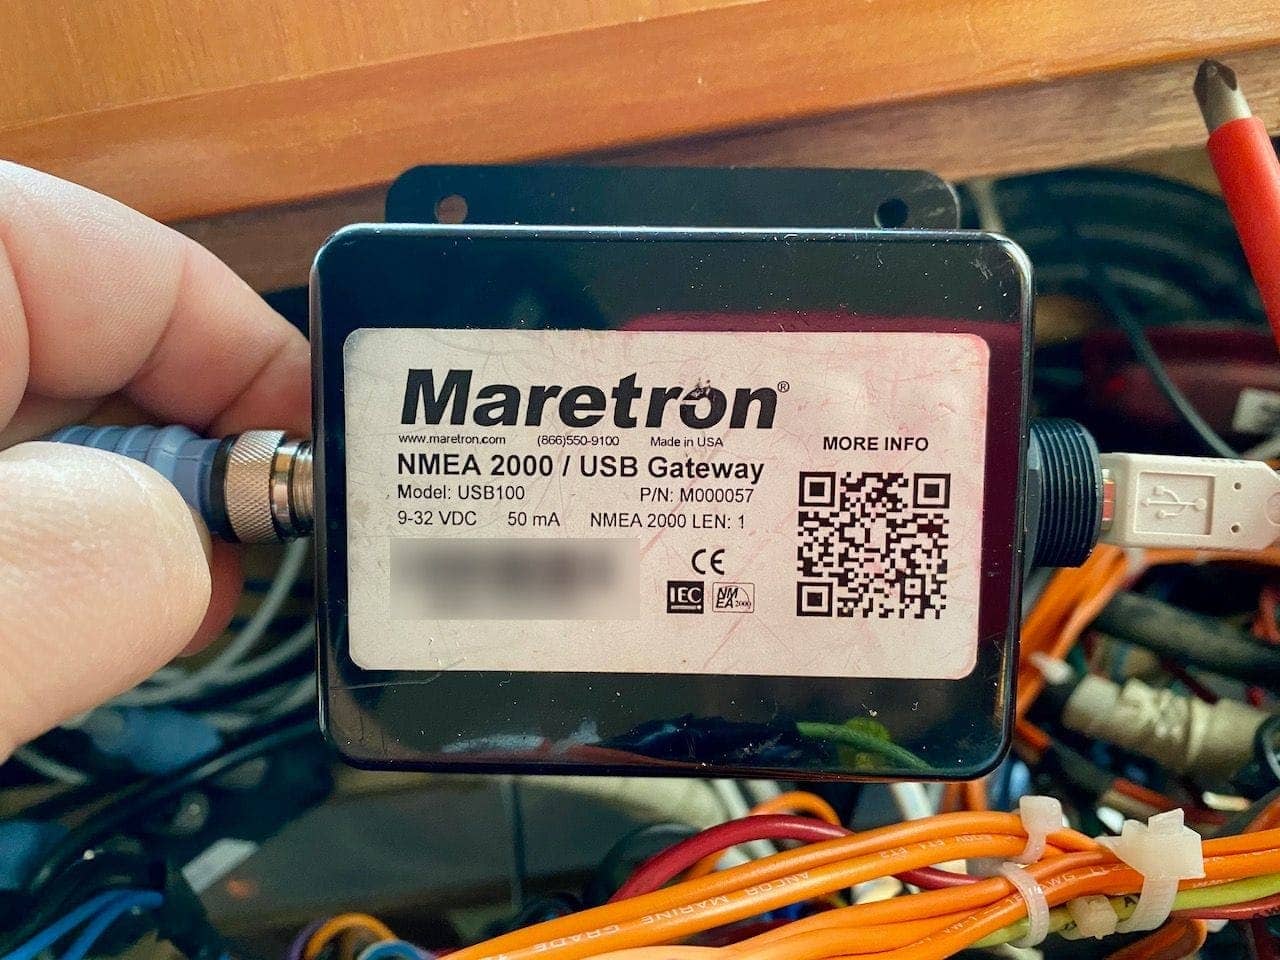
One of the longest running solutions I’ve used is Maretron’s USB-100 interface + N2KAnalyzer. It only runs on Windows, but it is very feature packed and useful when working on N2K networks. The software is free, but you have to purchase the USB-100 at $295 – but it’s worth it in my opinion. Not only is Maretron’s software easy to use and packed with features, but the USB-100 can be used as a PC navigation device as well. Also, if you have any Maretron devices at all, the USB-100 is almost a requirement for configuring and using them.
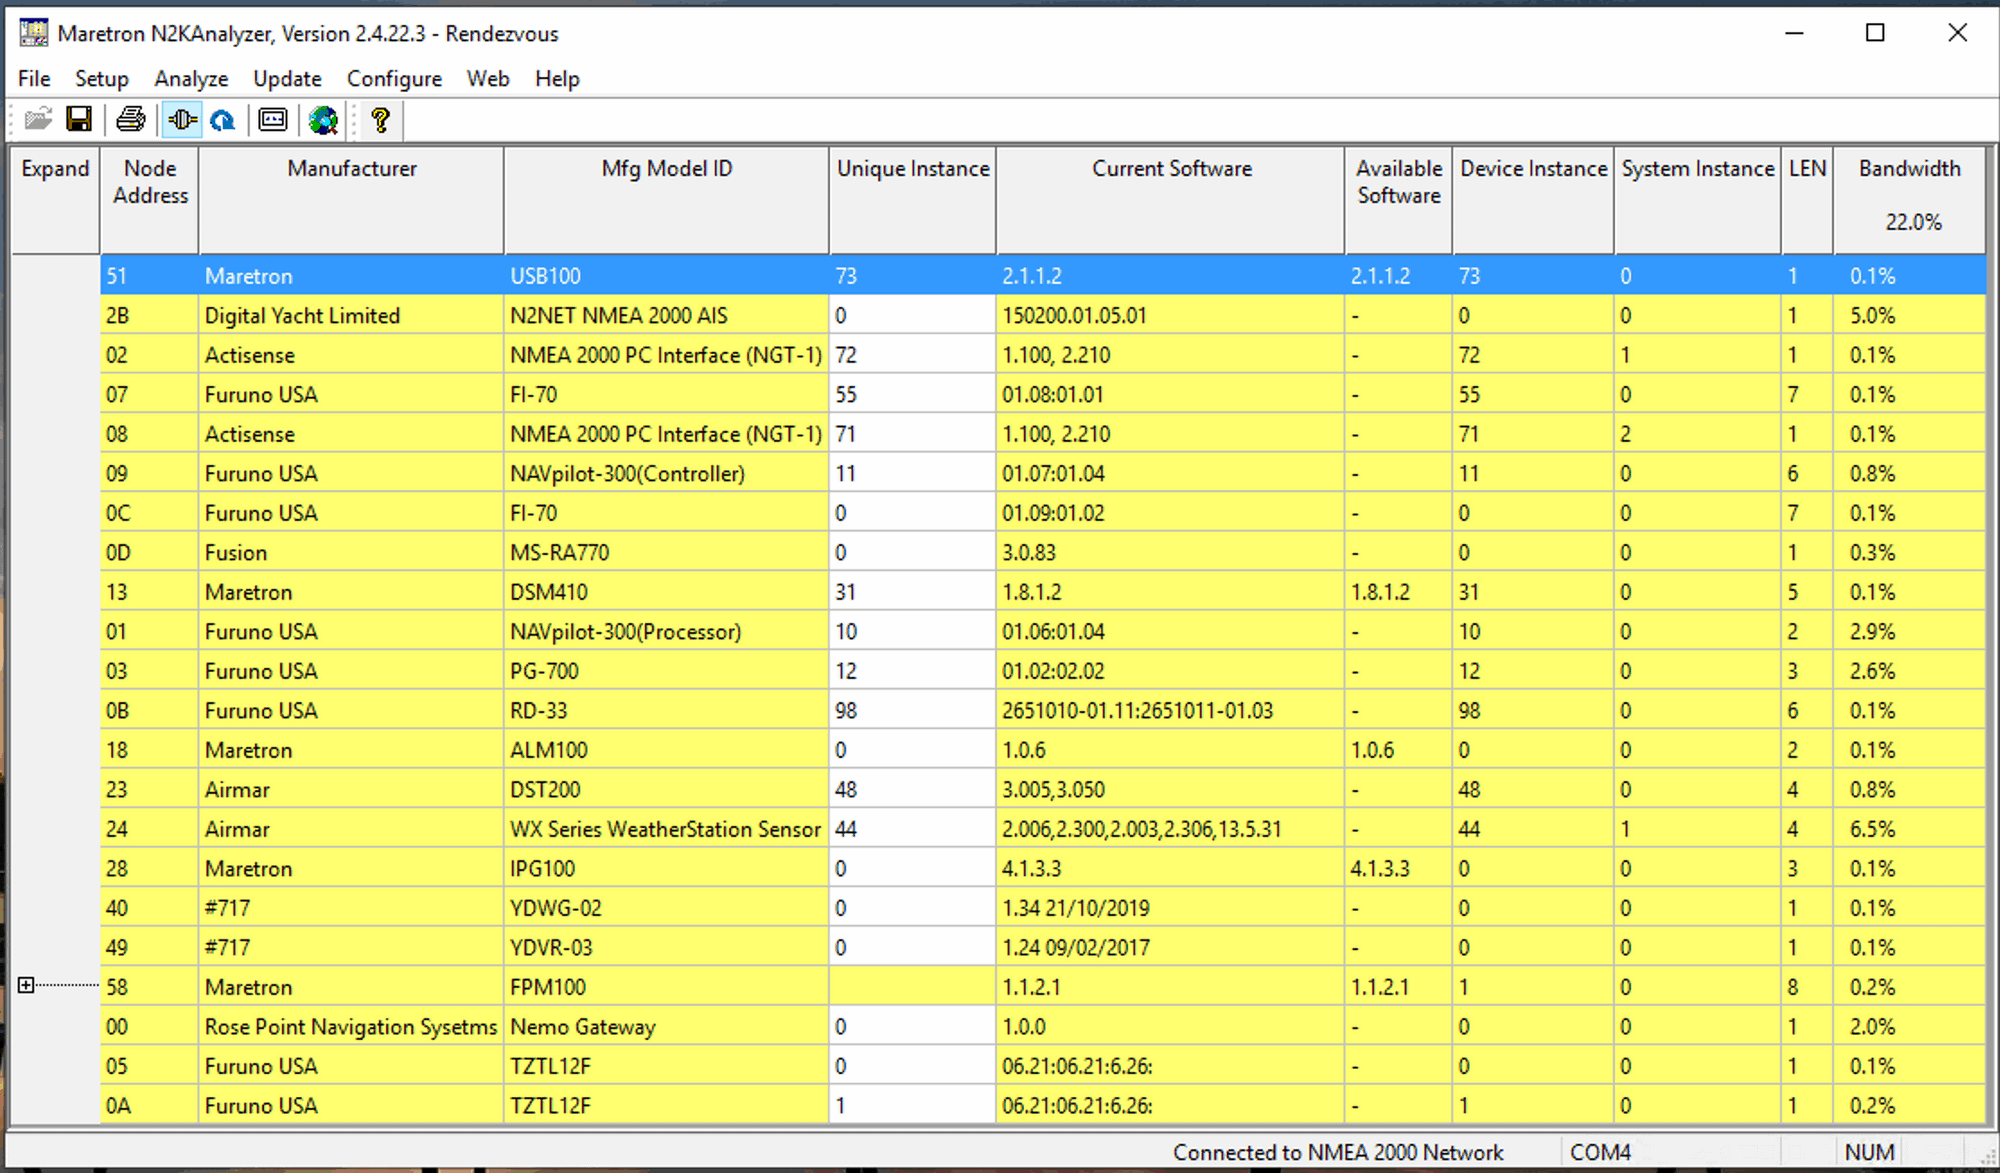
N2KAnalyzer is usually the first tool I start up to check on my network if I think there is an issue. The main screen is a nice compact list of all devices, software versions, instances, and bandwidth currently consumed on the N2K network by each one. It makes it very easy to see if something is missing or if something is going haywire and flooding the network.
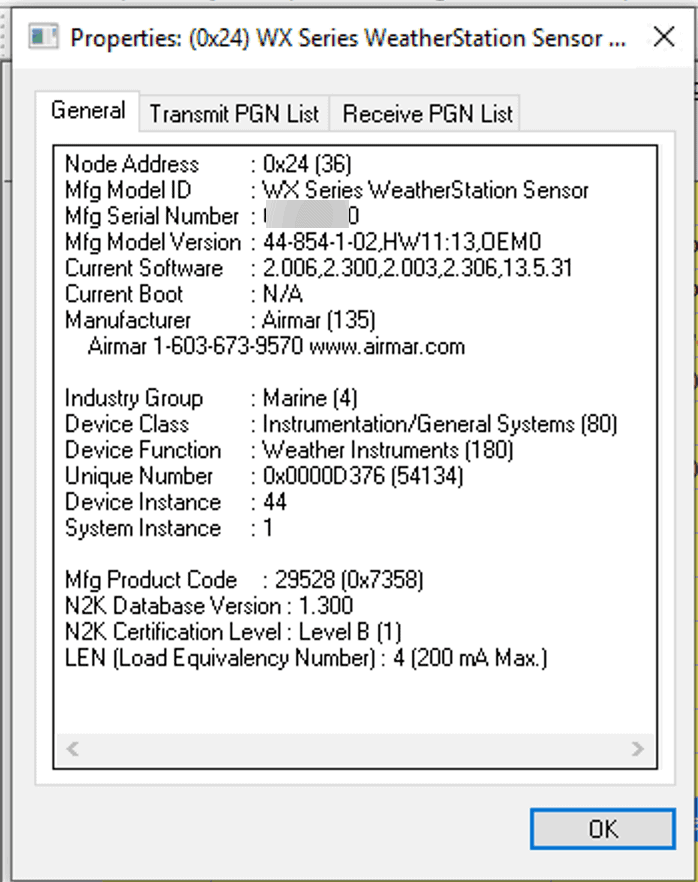
You can get detailed screens on each device. This can help you troubleshoot power issues – reviewing the LEN (Load Equivalency Number) for each one can help determine if you are within the right power budgets.
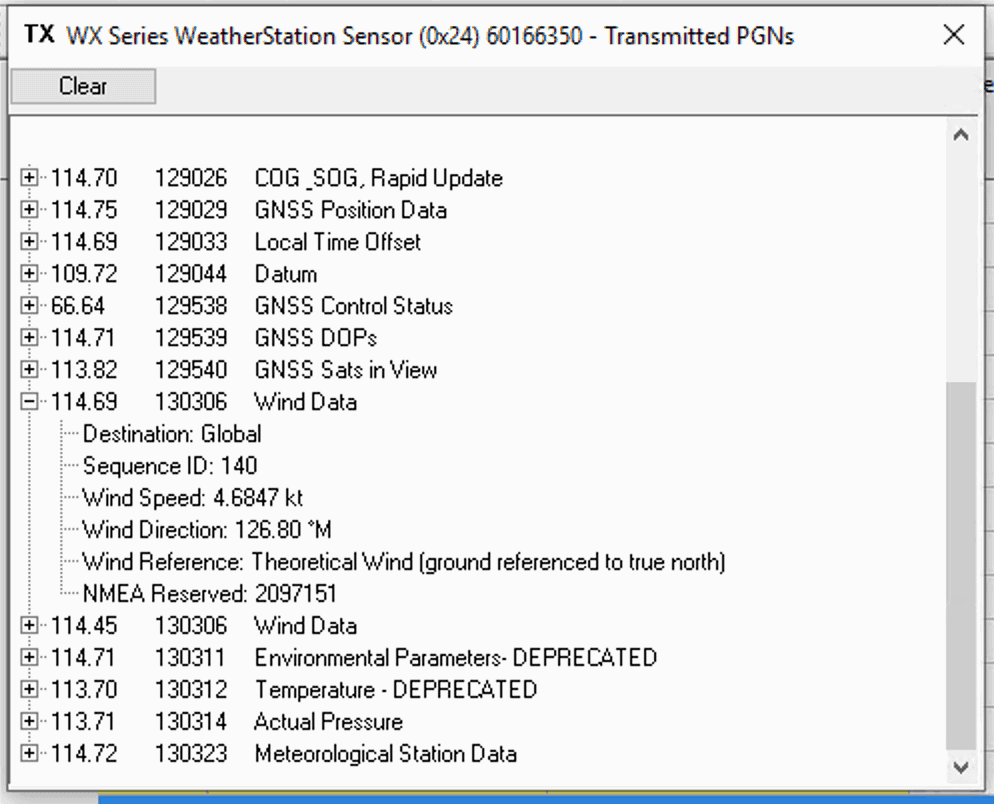
One of the main reasons I use N2KAnalyzer is its display of both received and transmitted PGNs. Above is my Airmar WX220 and I can drill down into each PGN and see what data is currently being sent. Super useful to figure out where a problem might be.
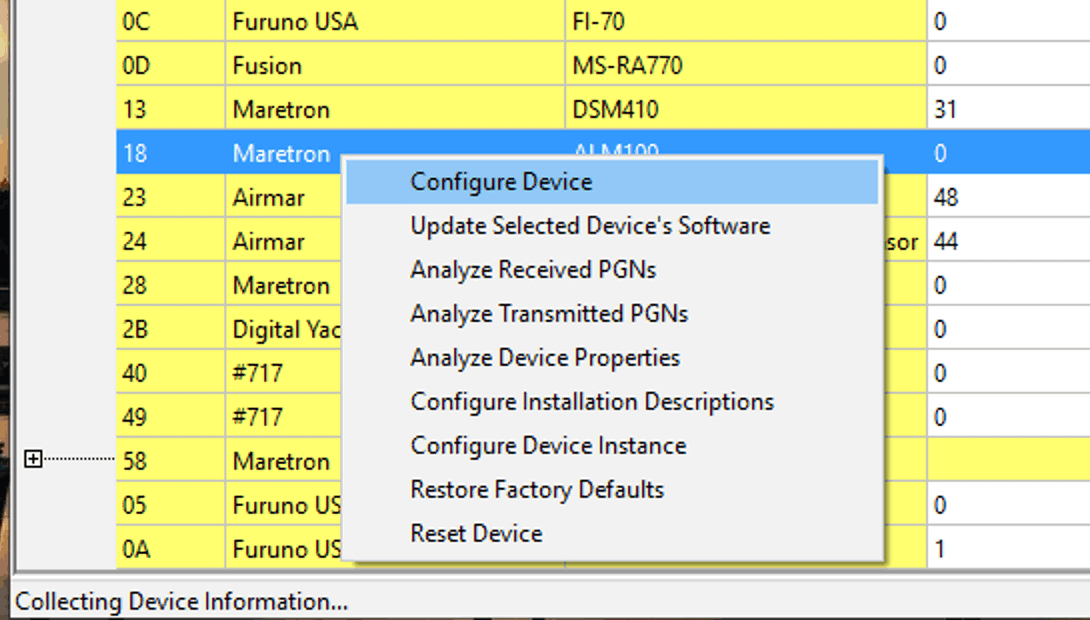
You can of course configure Maretron devices, as well as analyze PGNs and device properties.
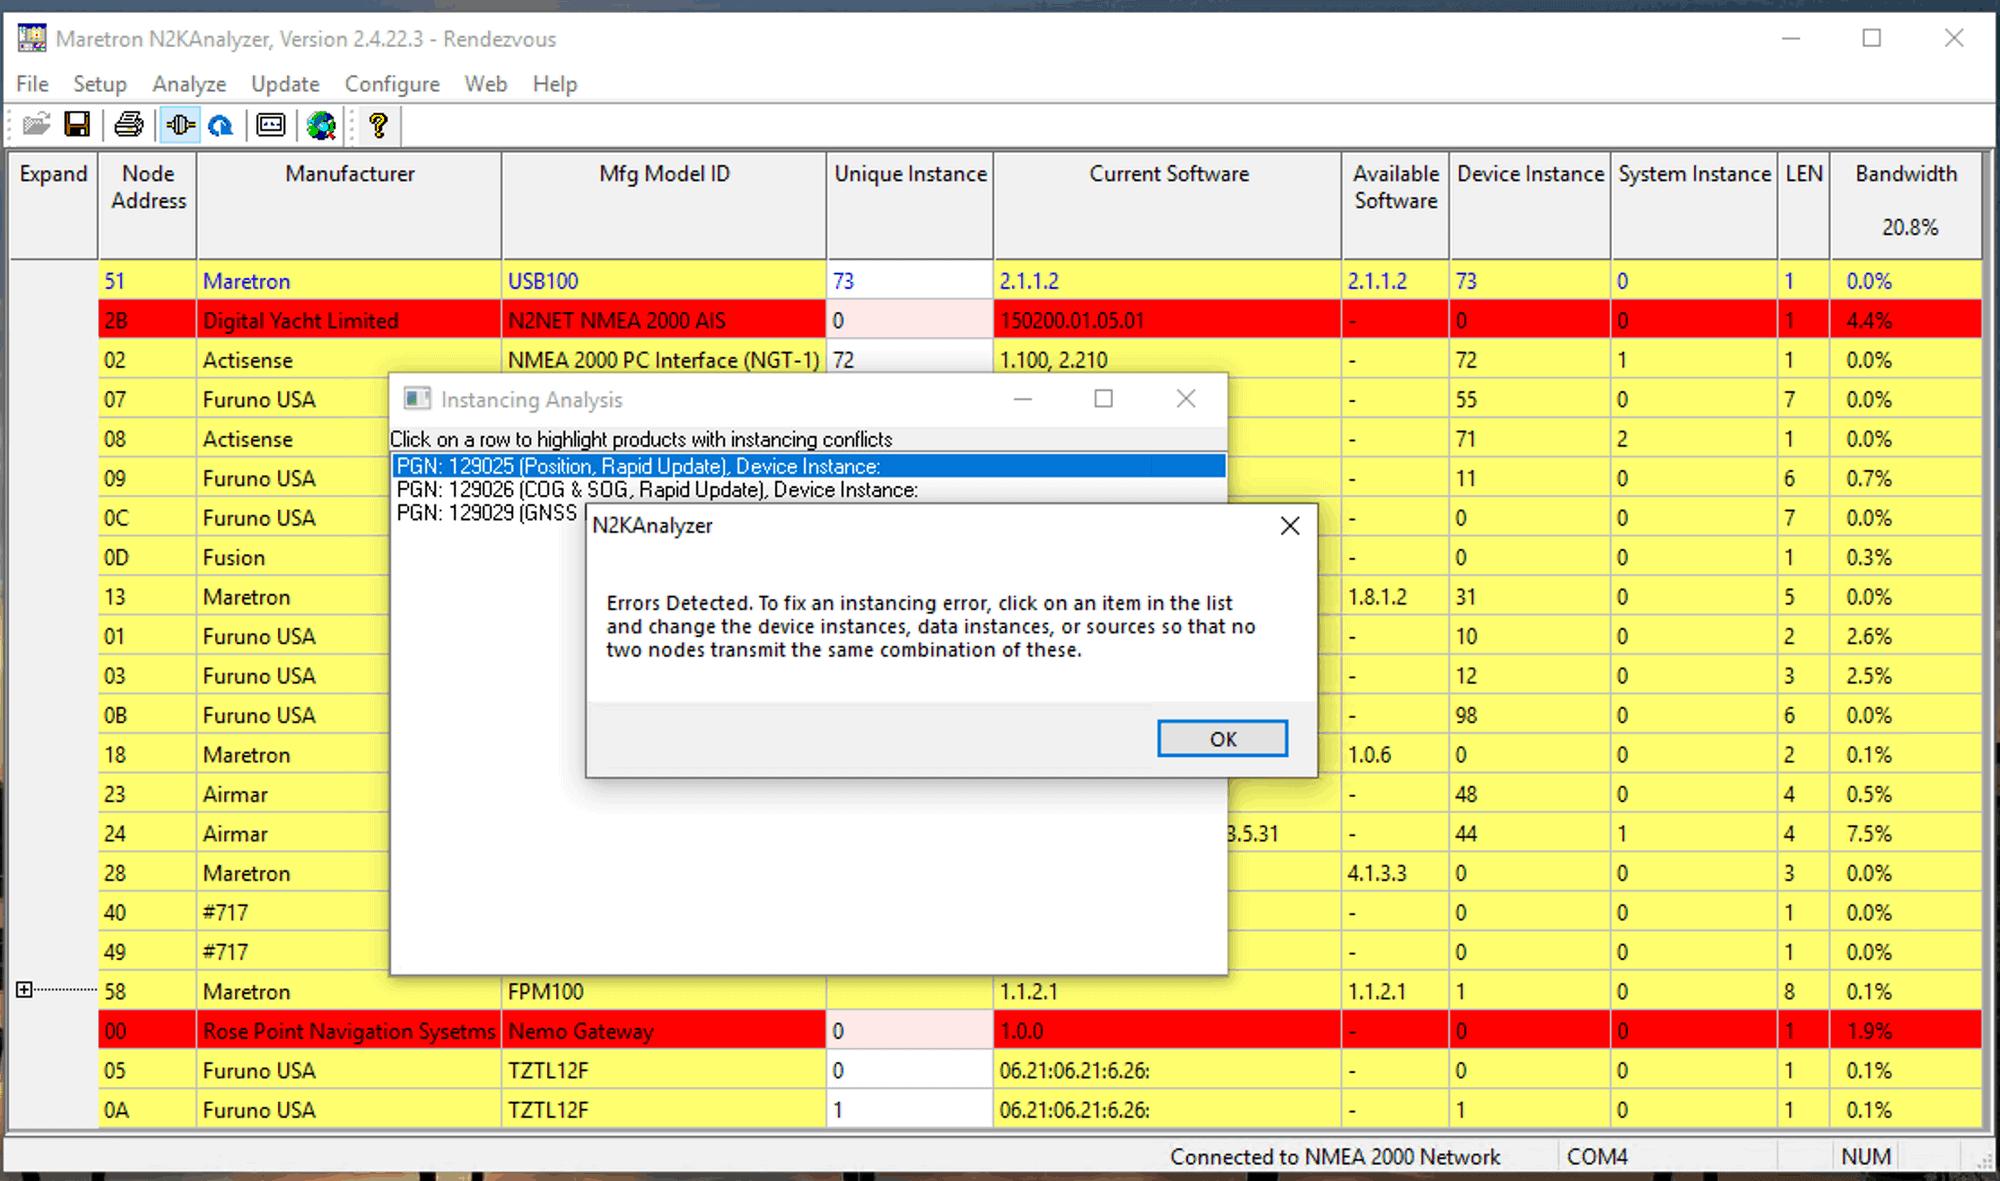
N2KAnalyzer also has a convenient Instancing Analysis feature which is very helpful. It runs for 30 seconds watching your network, and highlights any PGNs that are being transmitted wiht the same instance IDs, which is a no-no on NMEA 2000 networks. Here you can see two devices on my network are transmitting identical data with the same instance, and are highlighted in red. I now can go and configure correct instances to avoid any data corruption.
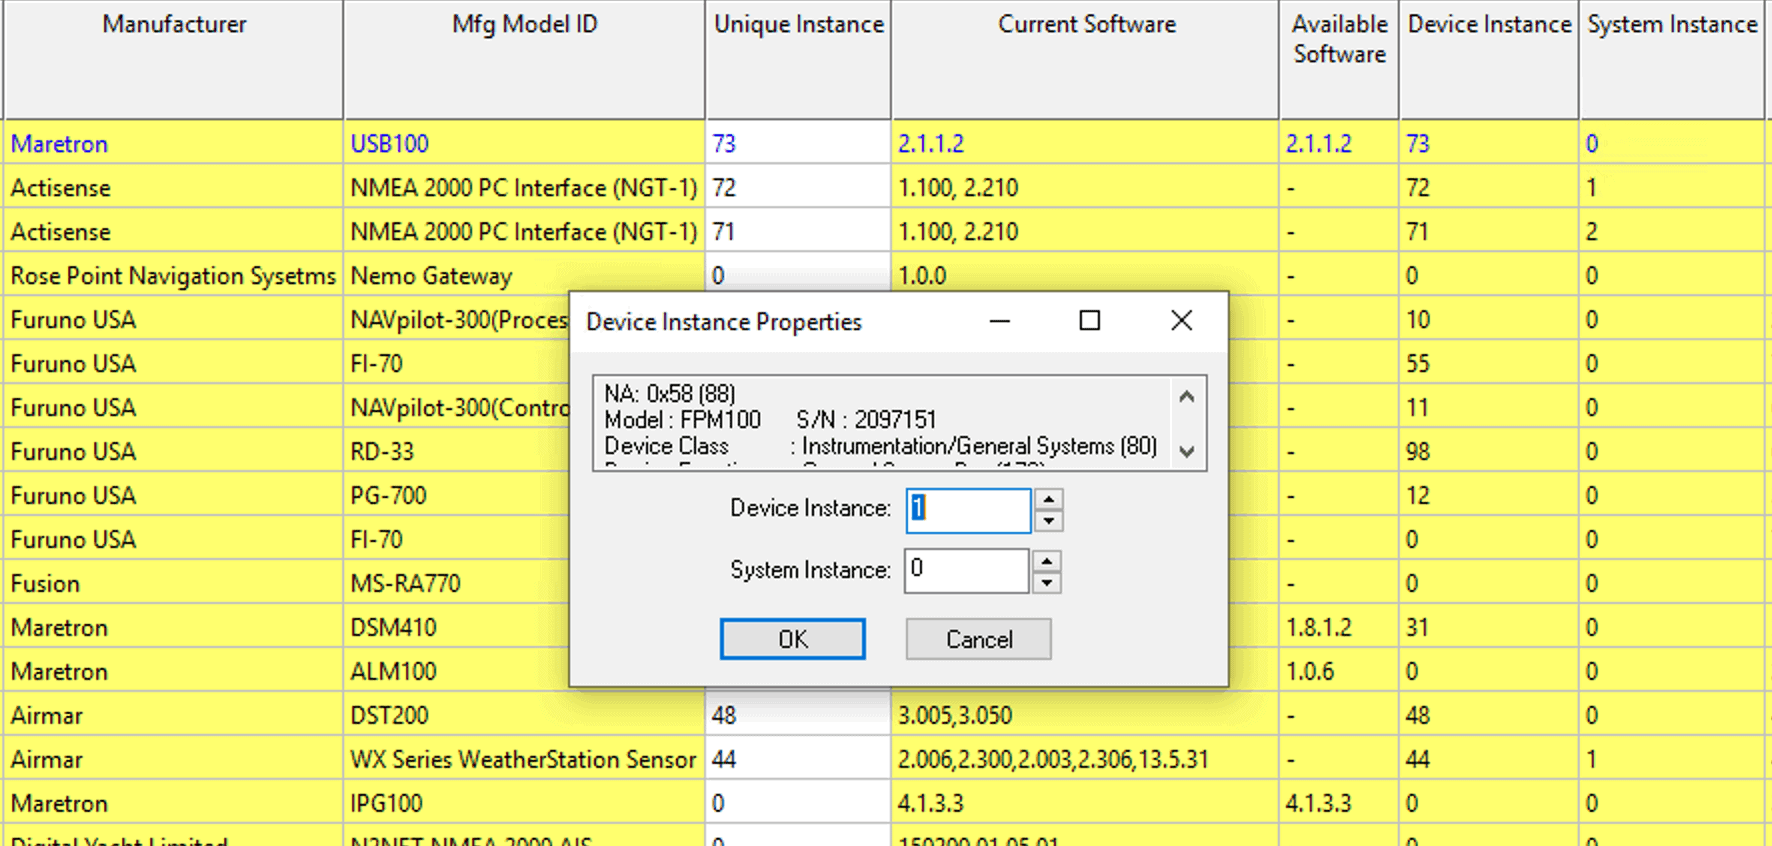
Changing instances is super easy in N2KAnalyzer, and can be done with a pop-up like above, or you can also just type into the Unique Instance column and set things all up and down the list very quickly.
I use N2KAnalyzer a lot, primarily to set instances, check instance conflicts, and all the time to look at transmitted PGNs when I’m troubleshooting why something doesn’t show up at one place or another.
Actisense
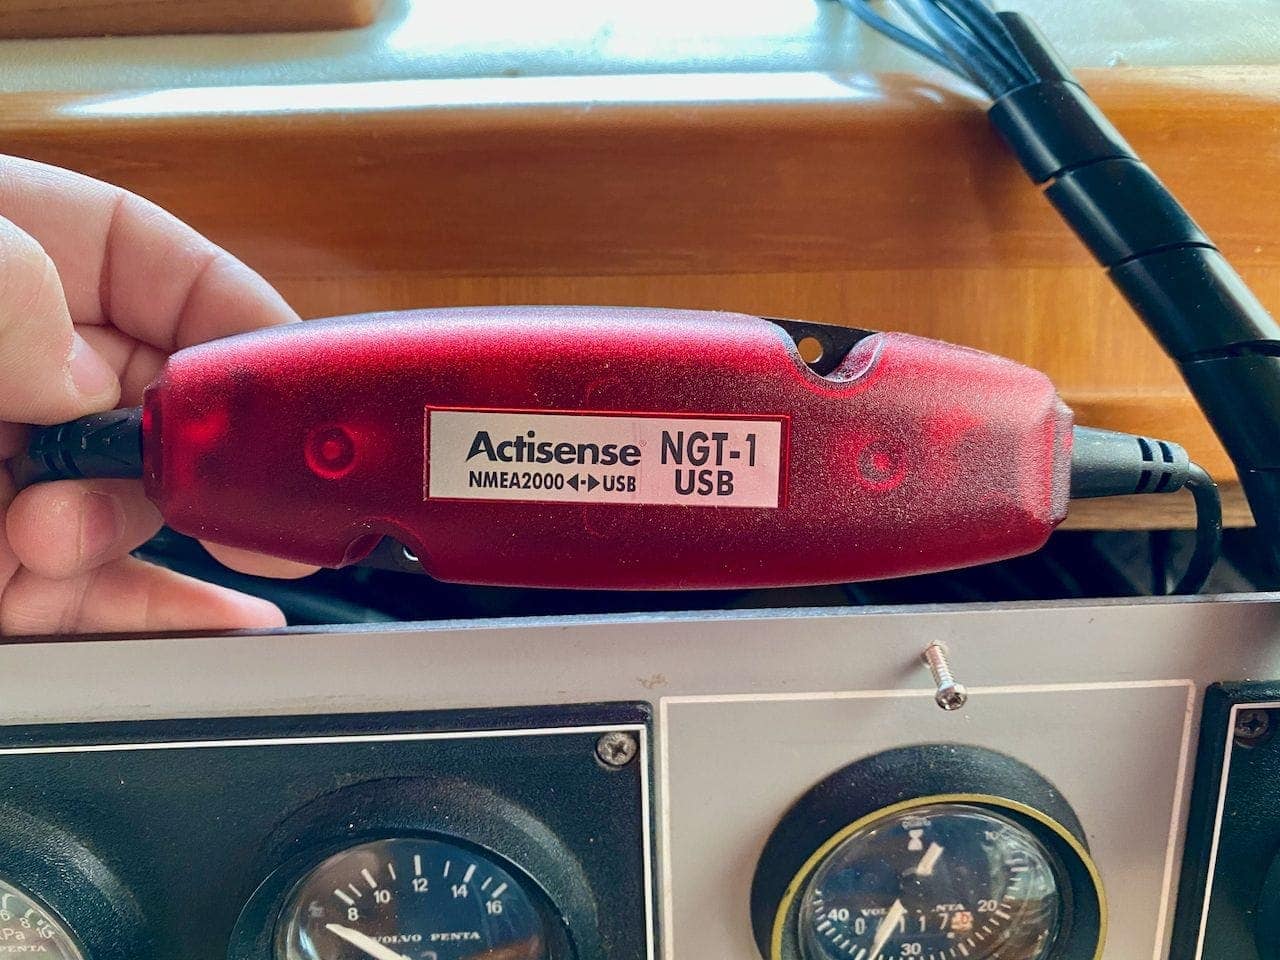
Another Windows-only choice is the Actisense NGT-1-USB + Actisense’s NMEAReader. You can use canboat with this as well, which I do often. But if you want a more graphical interface with lots more debug options, NMEAReader on Windows is a good option.
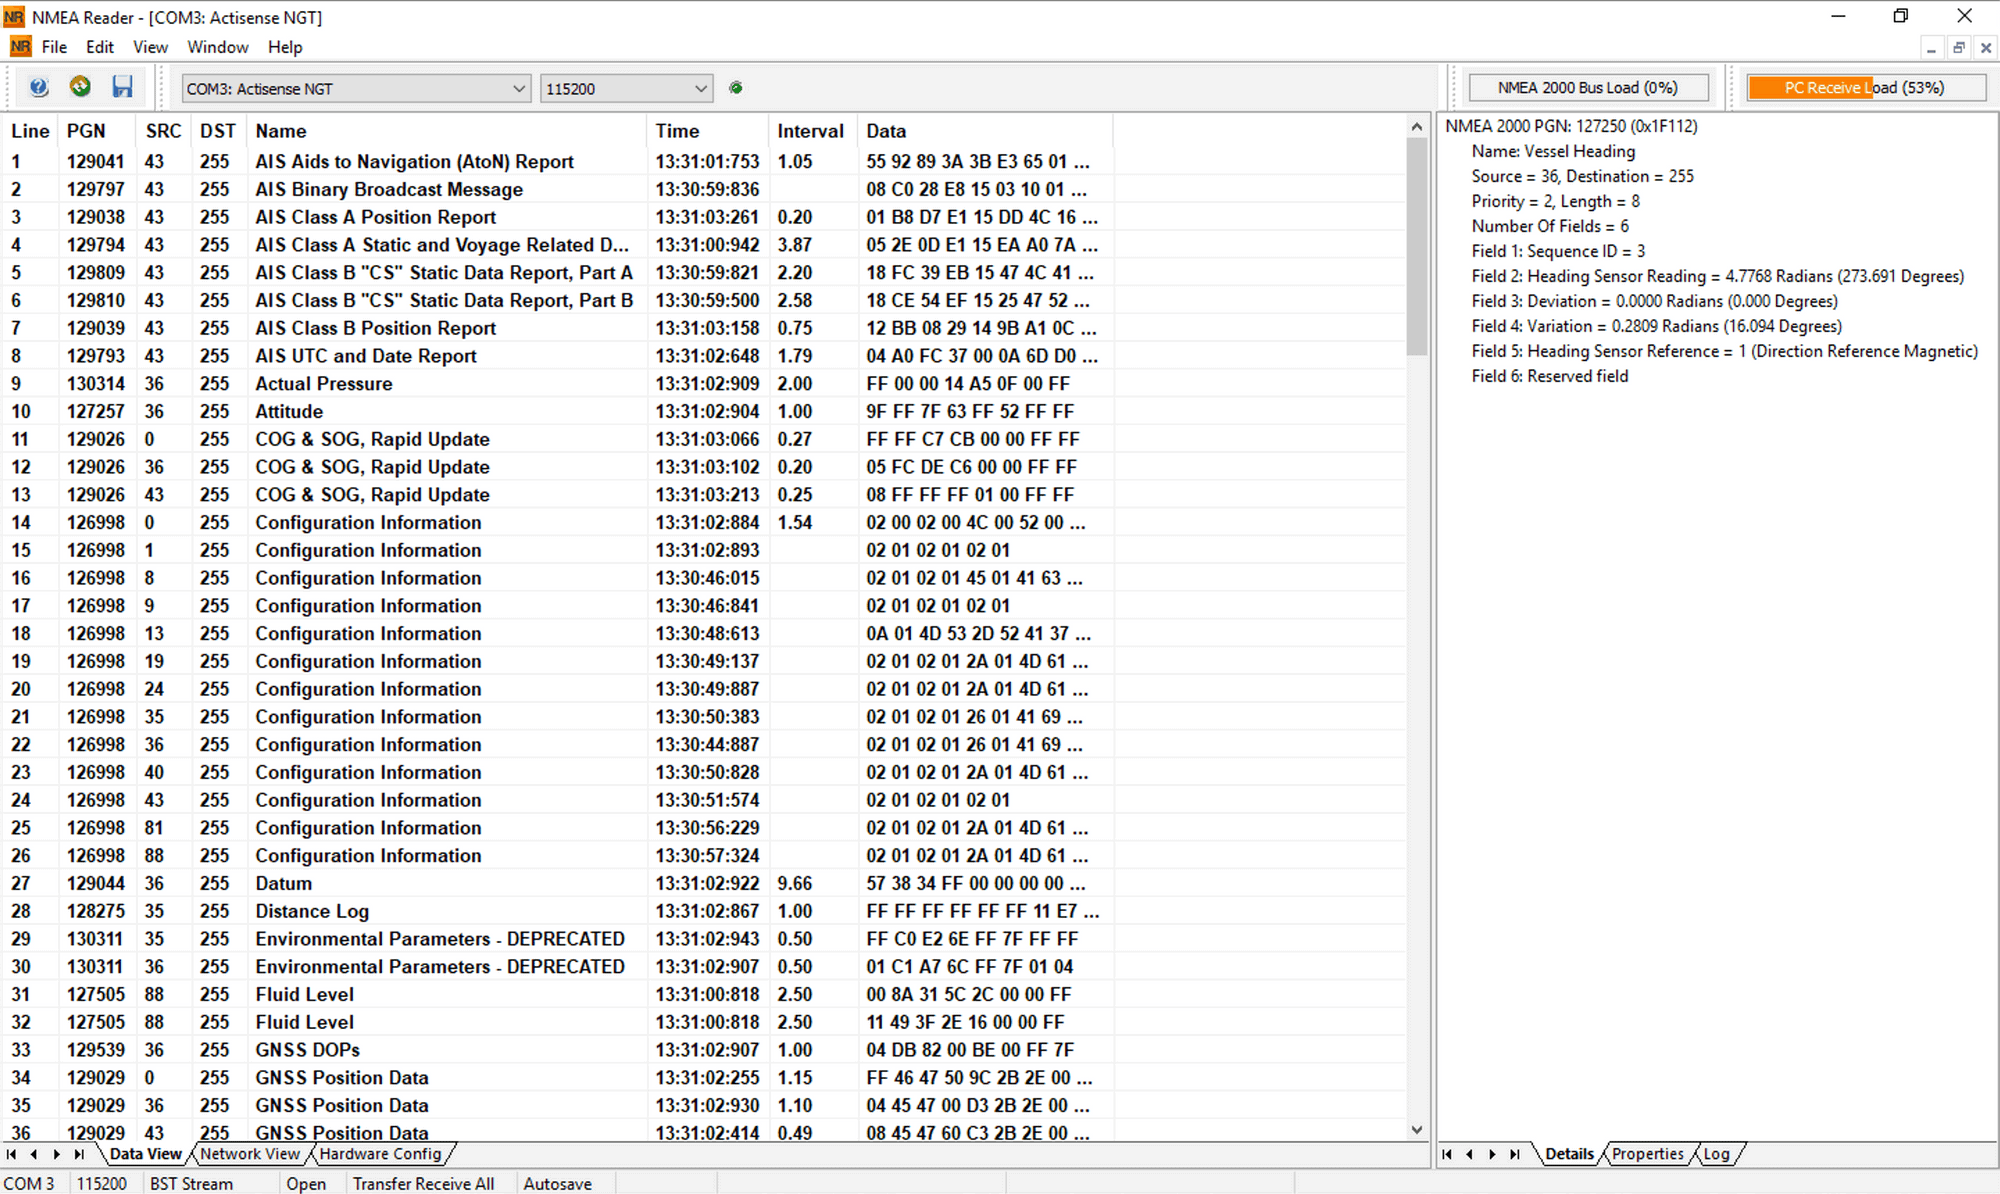
NMEA Reader has a lot of the same functionality as N2KAnalyzer, but it has one particular screen that no other solution provides, and I use constantly. The screen above shows all of the transmitted PGNs in one place, all updating real time. You can see above that there are three “COG & SOG, Rapid Update” PGNs all being transmitted, but with unique sources. This could help me track down an instancing issue where multiple devices are sending the same data without unique IDs and confusing instruments that rely on the data.
This is one of the only and best ways to see all of the data going back and forth on your NMEA 2000 bus in a single place, all updating real time, and the ability to quickly drill down into each set of data. If you’re missing data from a device, or have duplicate/bad data, this is the tool to use first.
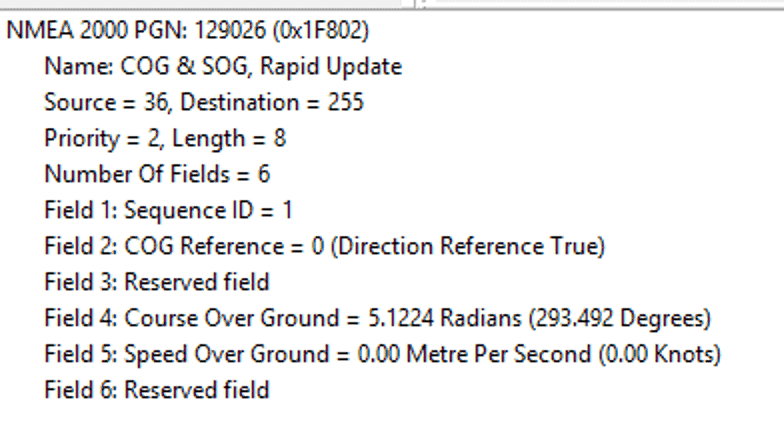
Clicking on a row shows the data for that particular PGN updating real time.
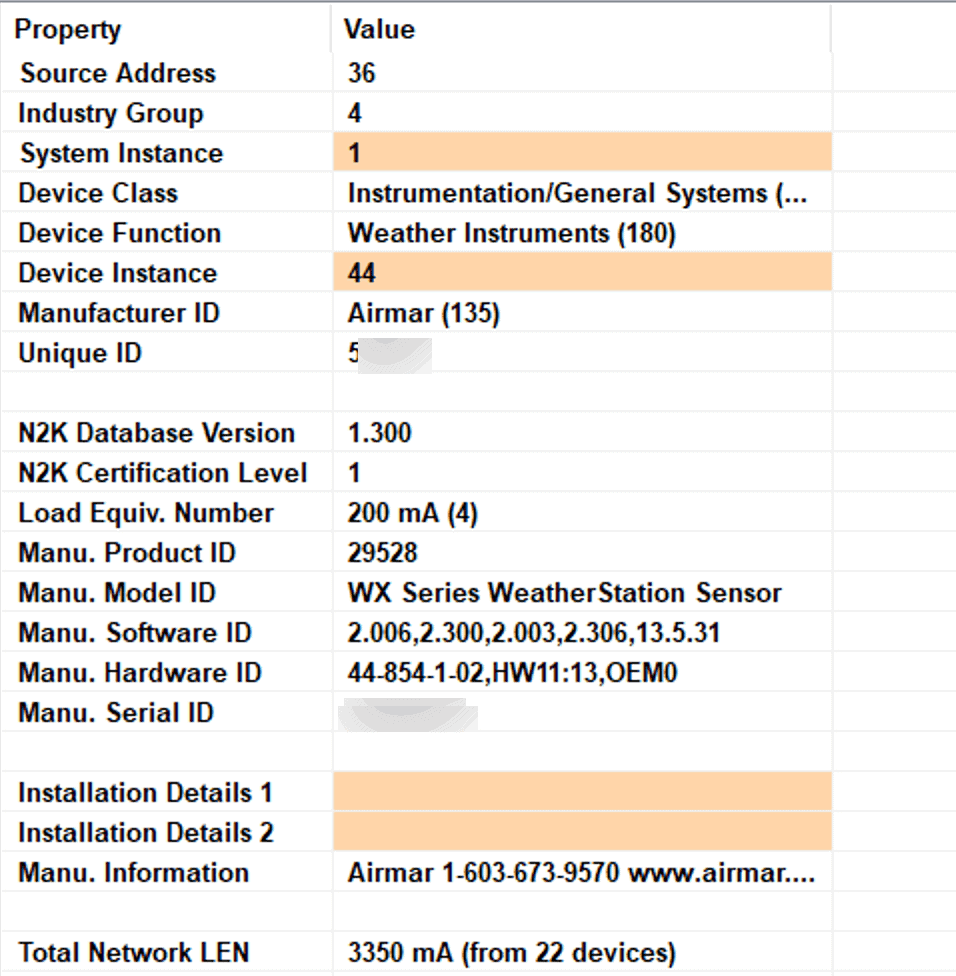
The tabs below allow you to cycle between the PGN details and the properties of the device sending it, which is very useful as well. You can change instances here, as well as see the overall power usage (Total Network LEN) for your NMEA 2000 network.
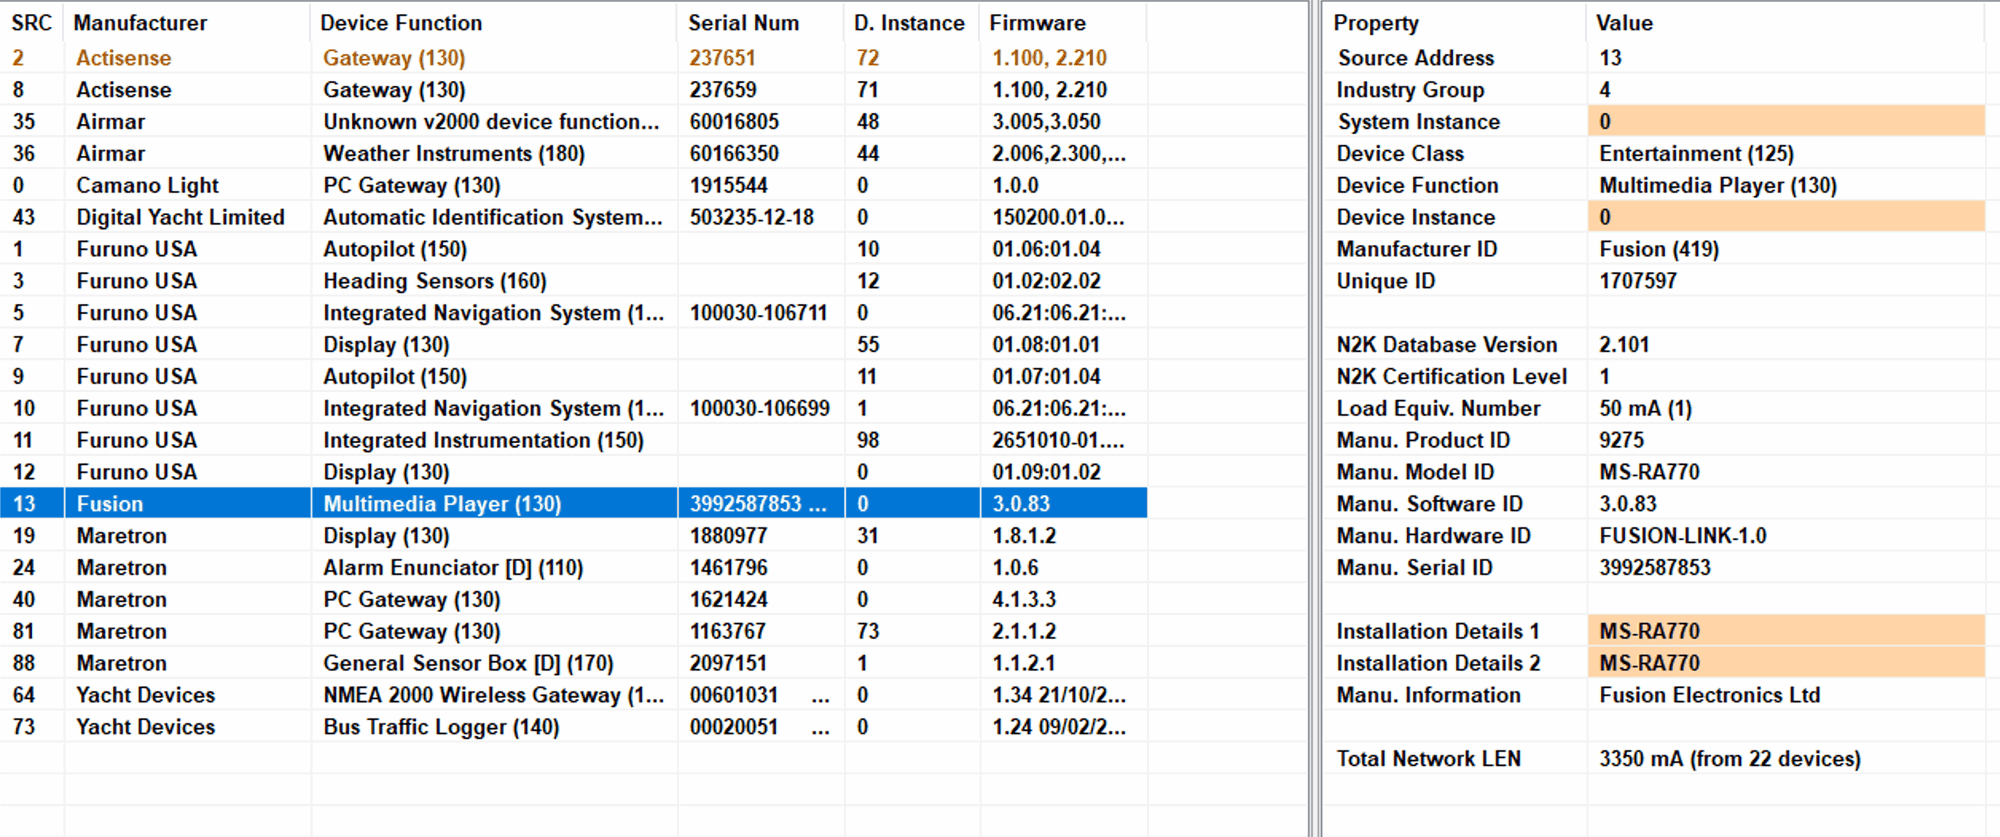
NMEA reader has the device list as well, but I find N2KAnalyzers easier to use with more options. NMEA Reader is great at showing real-time traffic from your network in a very compact way and to help with instancing issues.
Conclusion
NMEA 2000 networks are sometimes fiddly and challenging to work with. They are not easily diagnosable when it comes to problems, and aren’t as easy to tap into as other networking we’re used to today. However, with a cheap investment such as half a NMEA 2000 cable, or a bit more on a computer interface, you should be able to track down the majority of common issues.

