With the huge network I have on Grace, capturing everything that is going on in a useful form is sometimes difficult. For individual trips, I usually grab the track points off of my Raymarine or take a screen shot to remember things by. While at anchor or at the dock, it’s harder to gather info to do analysis or just show what was going on. In the past I’ve used Kees Verruijt’s great canboat system to dump raw NMEA 2000 via a linux machine to analyze later, but converting them to something useful has always been a challenge.
After installing a Yacht Devices Text Display last year, I noticed they had a product that might help me with my constant quest for getting data off the boat – the Yacht Devices Voyage Recorder. The product records all data off of your NMEA 2000 or SeaTalk network to an SD card. The resulting files can be copied to a computer and analyzed in various different ways – generate maps of your travels, look at performance of your boat, create a polar analysis, and more.
Overview
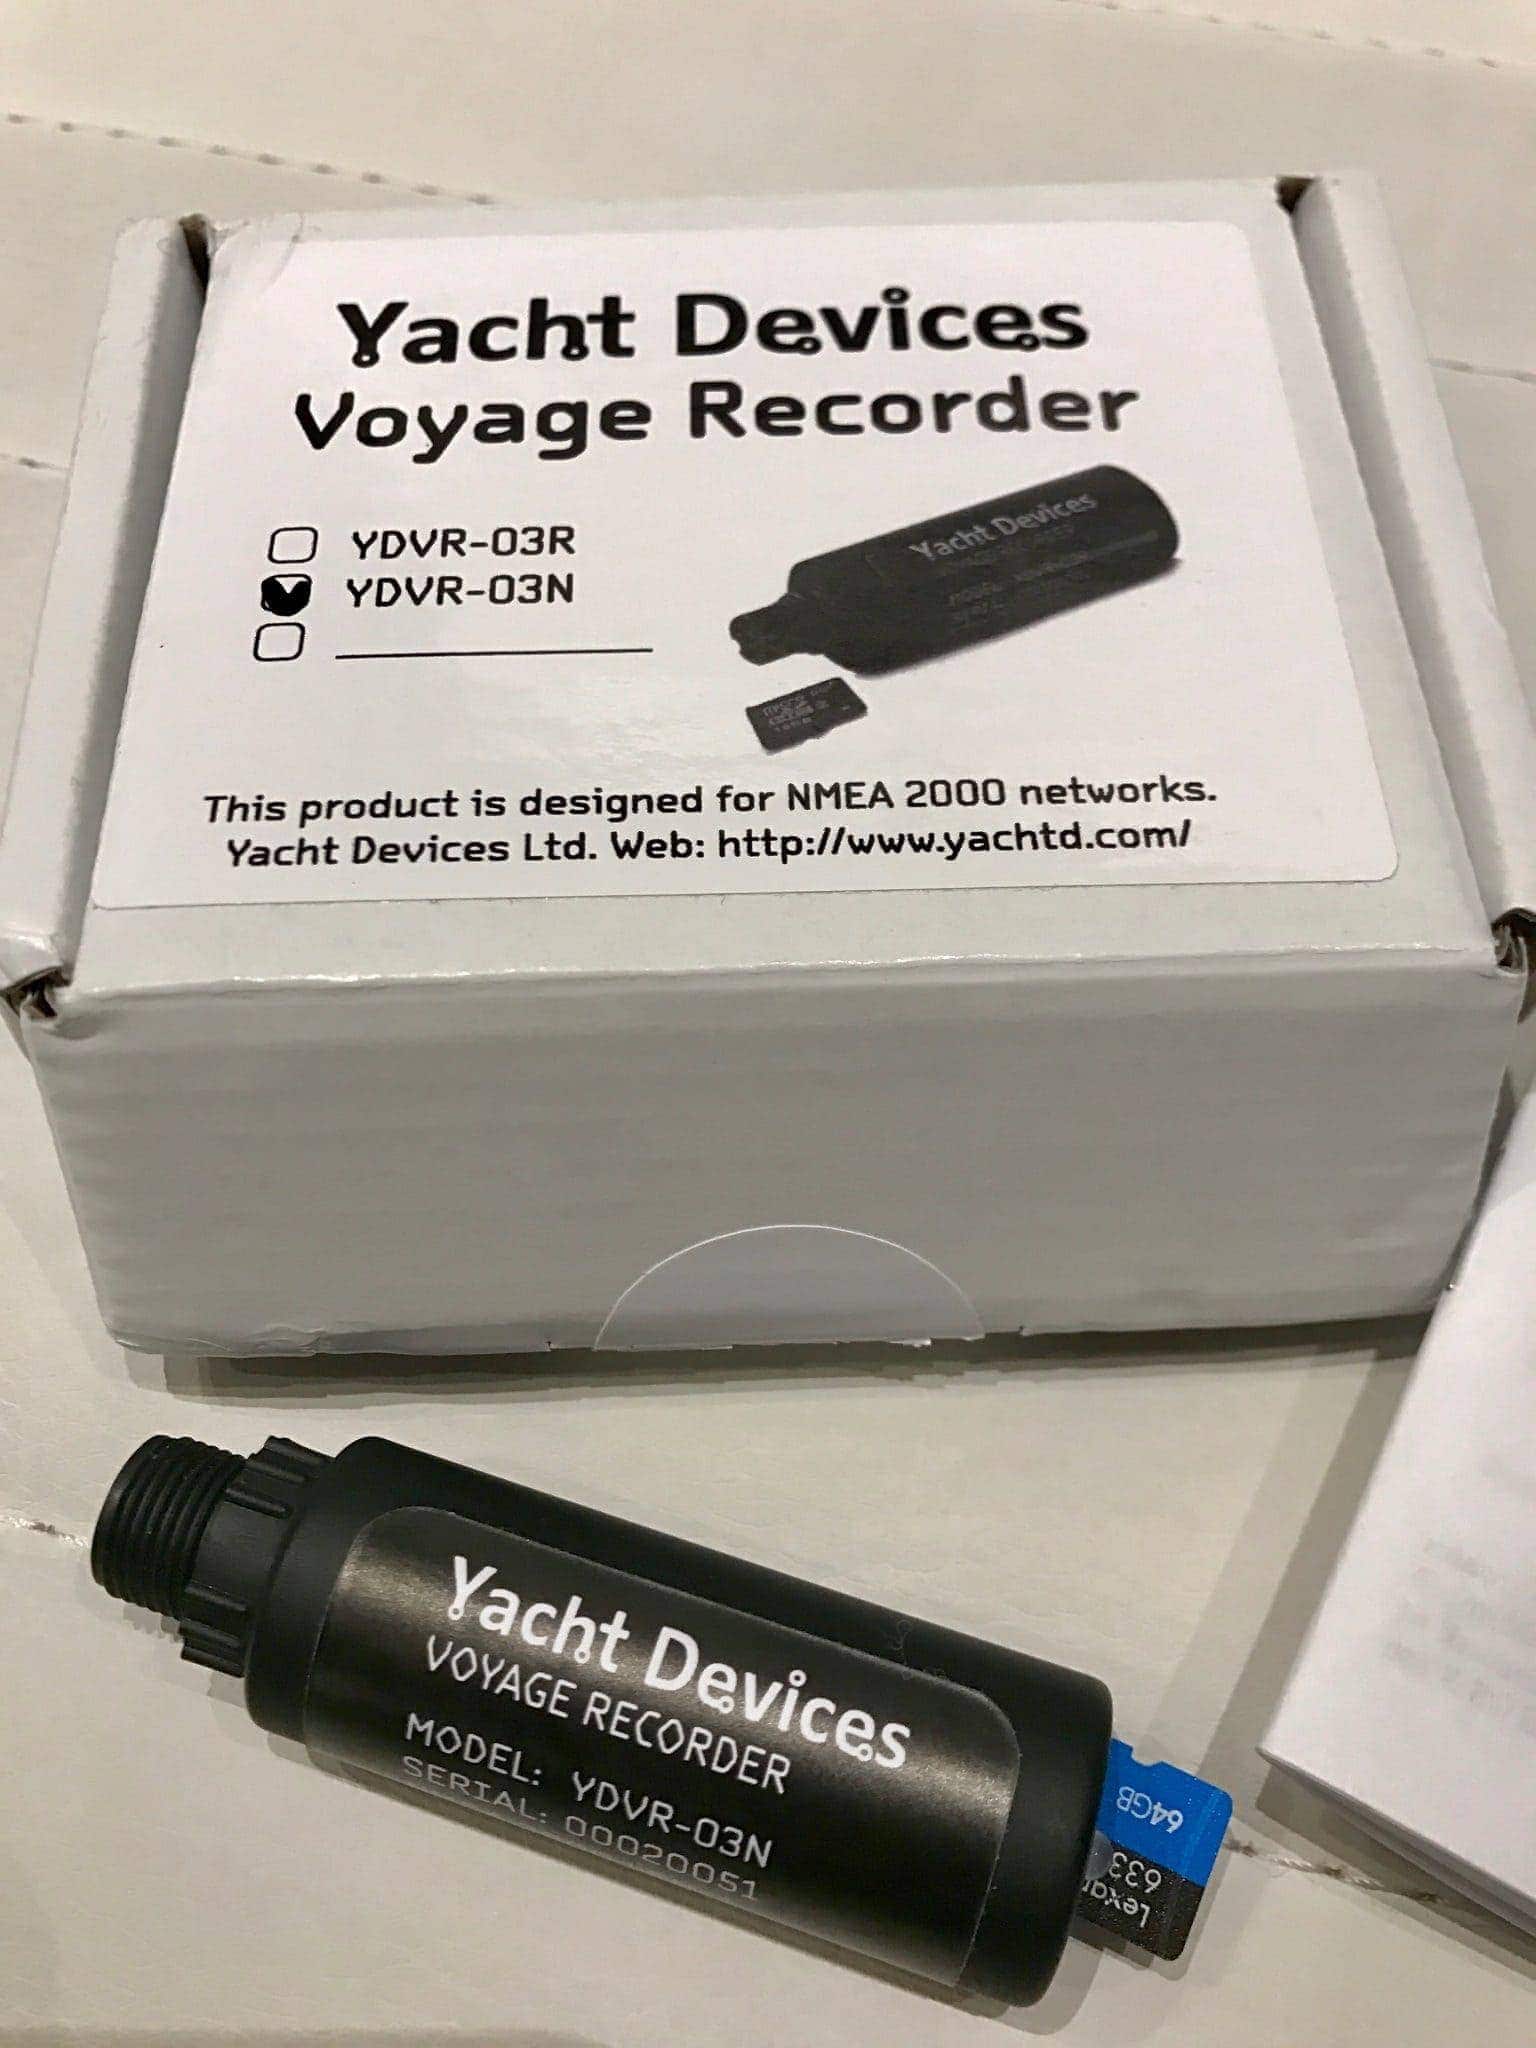
The Voyage Recorder is a tiny device that comes in a NMEA 2000 and Raymarine SeaTalk version. I chose the NMEA 2000 version even though I have SeaTalk in my network so that I could use it in more places. It comes with a great manual along with the device itself – you have to provide your own SD card to record data onto.
Based on their general guidelines, Yacht Devices says you can record 100-200 days on a 16GB card – yes you read that right – 100-200 days worth of data! That is a heck of a long time – you could leave it in for most of the summer and not have to worry about it, then analyze the season after you were done. I think given the chattiness of my network that will be a challenge to meet.
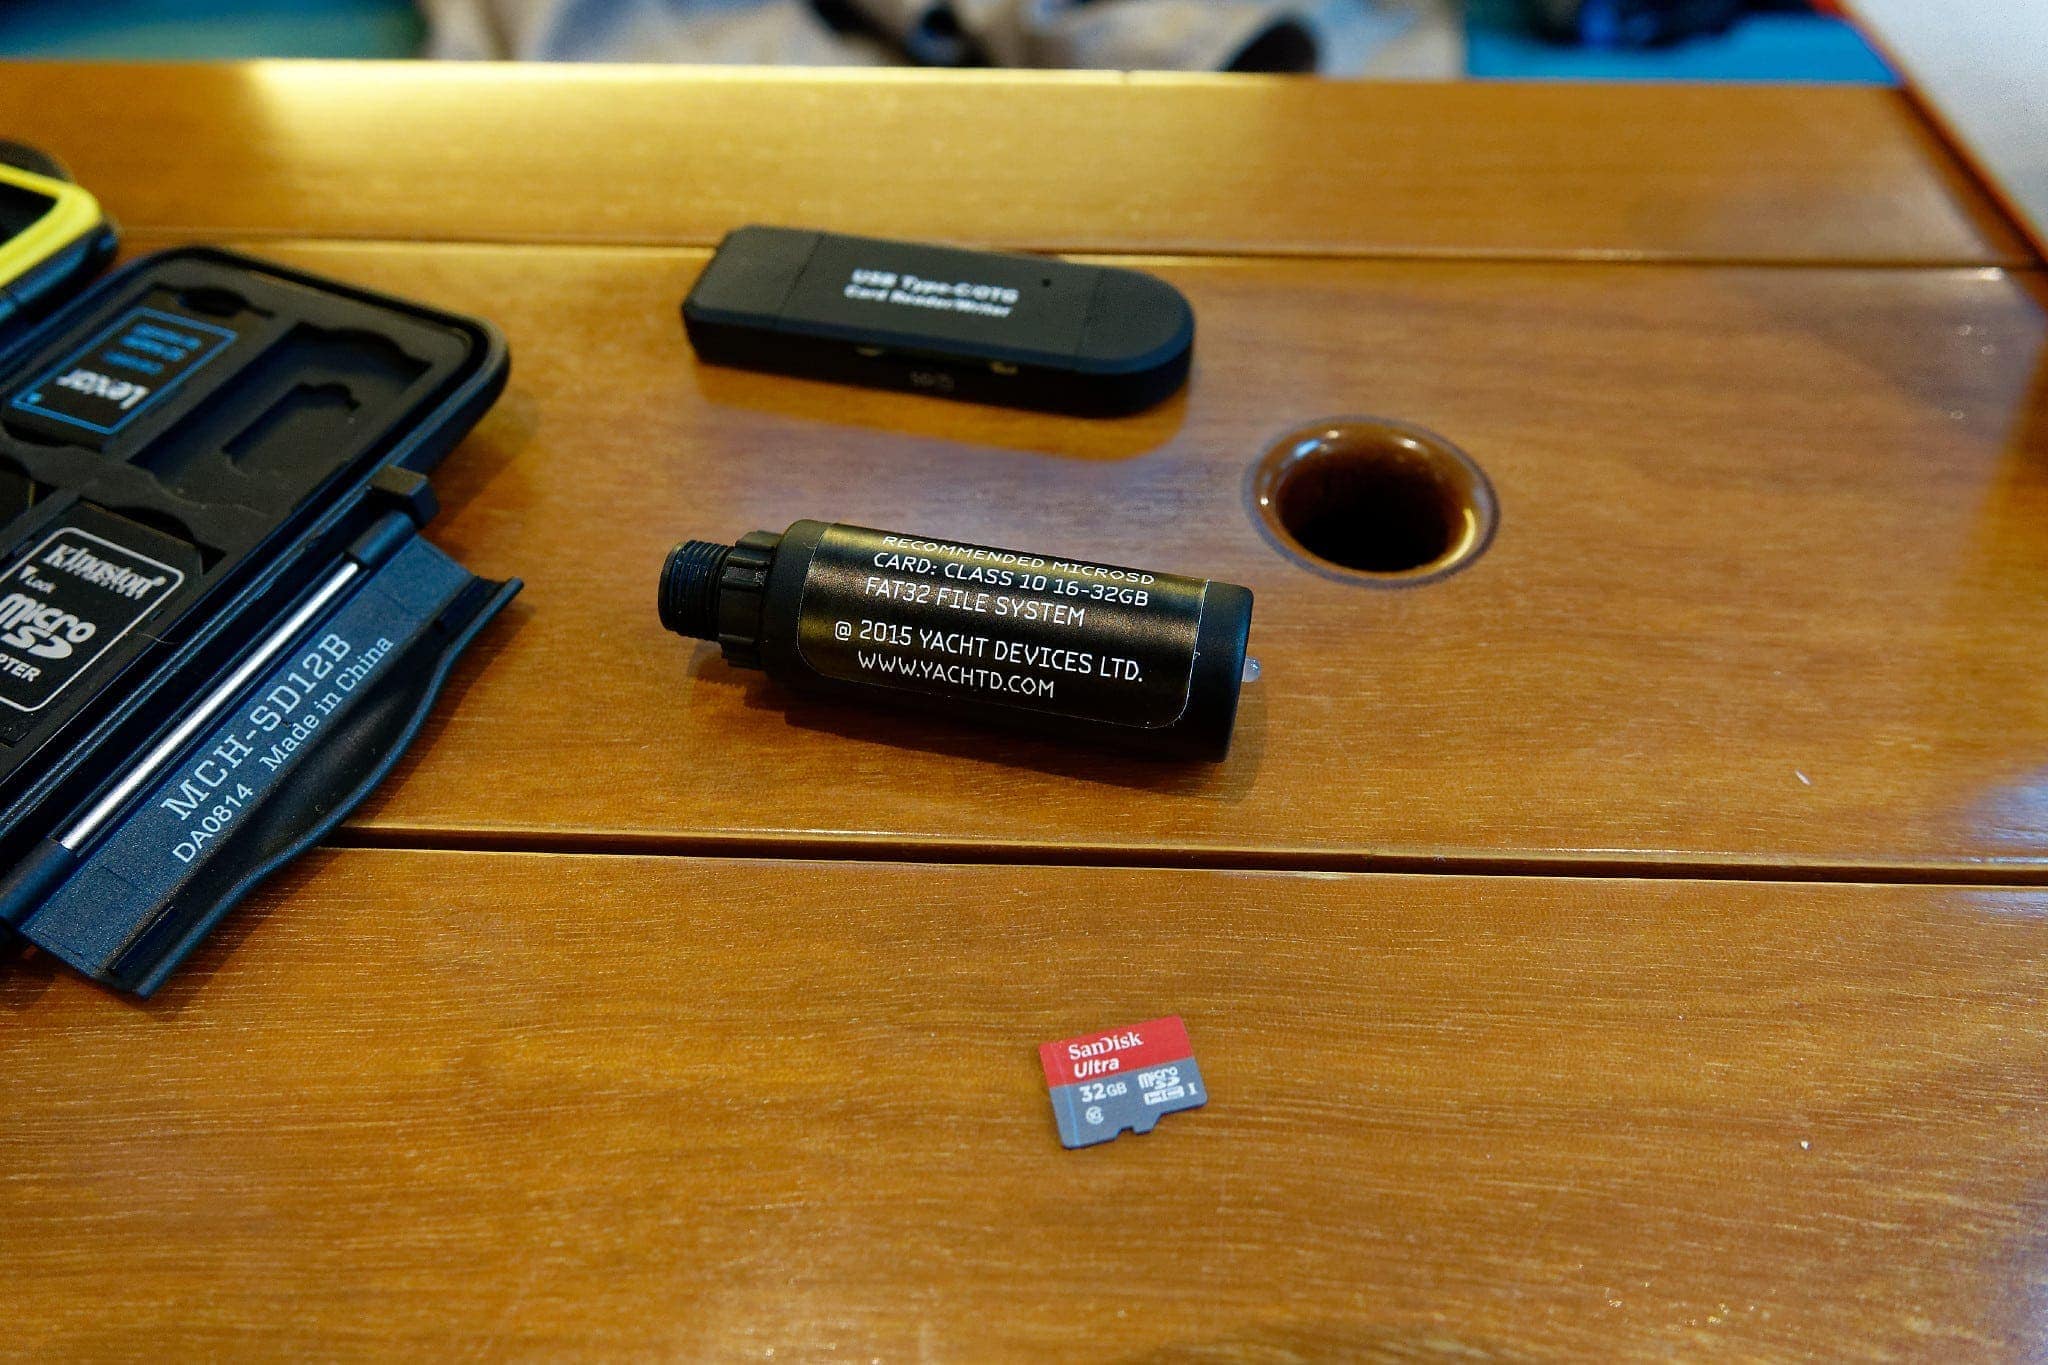
Voyage recorder with SD card prepared for use
Installation
The SD card is an important choice – the amount of data and frequency that things are written to the card mean that a high quality, class 10 card, formatted correctly is critical. The manual goes over the specifics very well, even providing a link to tools to format things correctly. My network being as busy and complex as it is, I chose to install a 32GB card that had not been used before, formatted with FAT32, 64k block sizes.
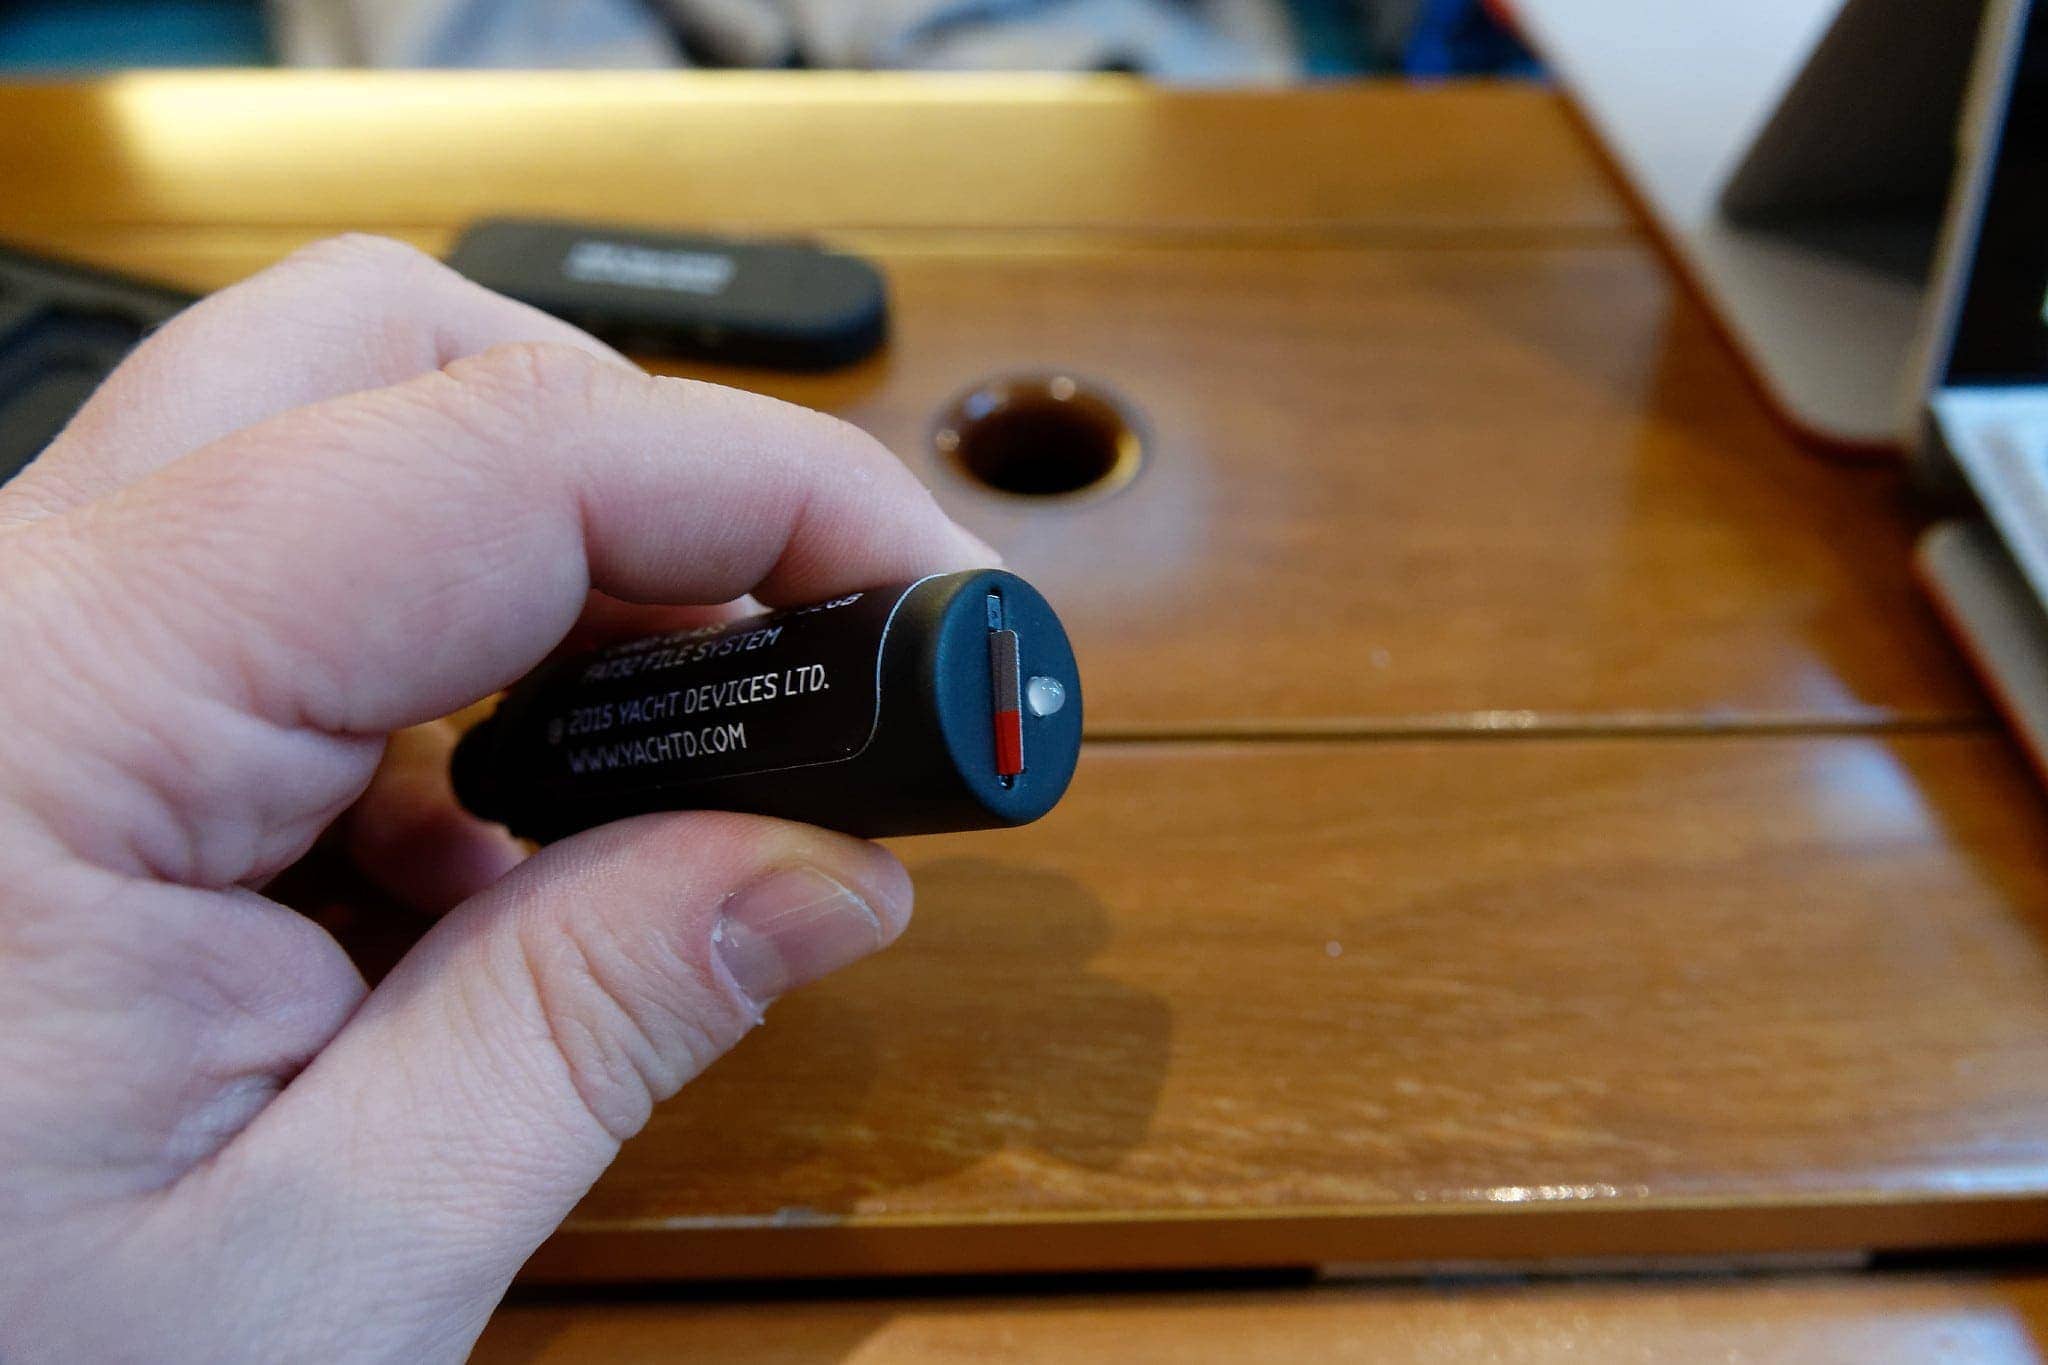
SD card slot and LED
That’s really all there is to installation. You can upgrade the firmware by placing a firmware file in the root of the SD card and connect the device to the network for a few seconds. The details are clearly outlined in the great manual (did I mention they had a great manual?).
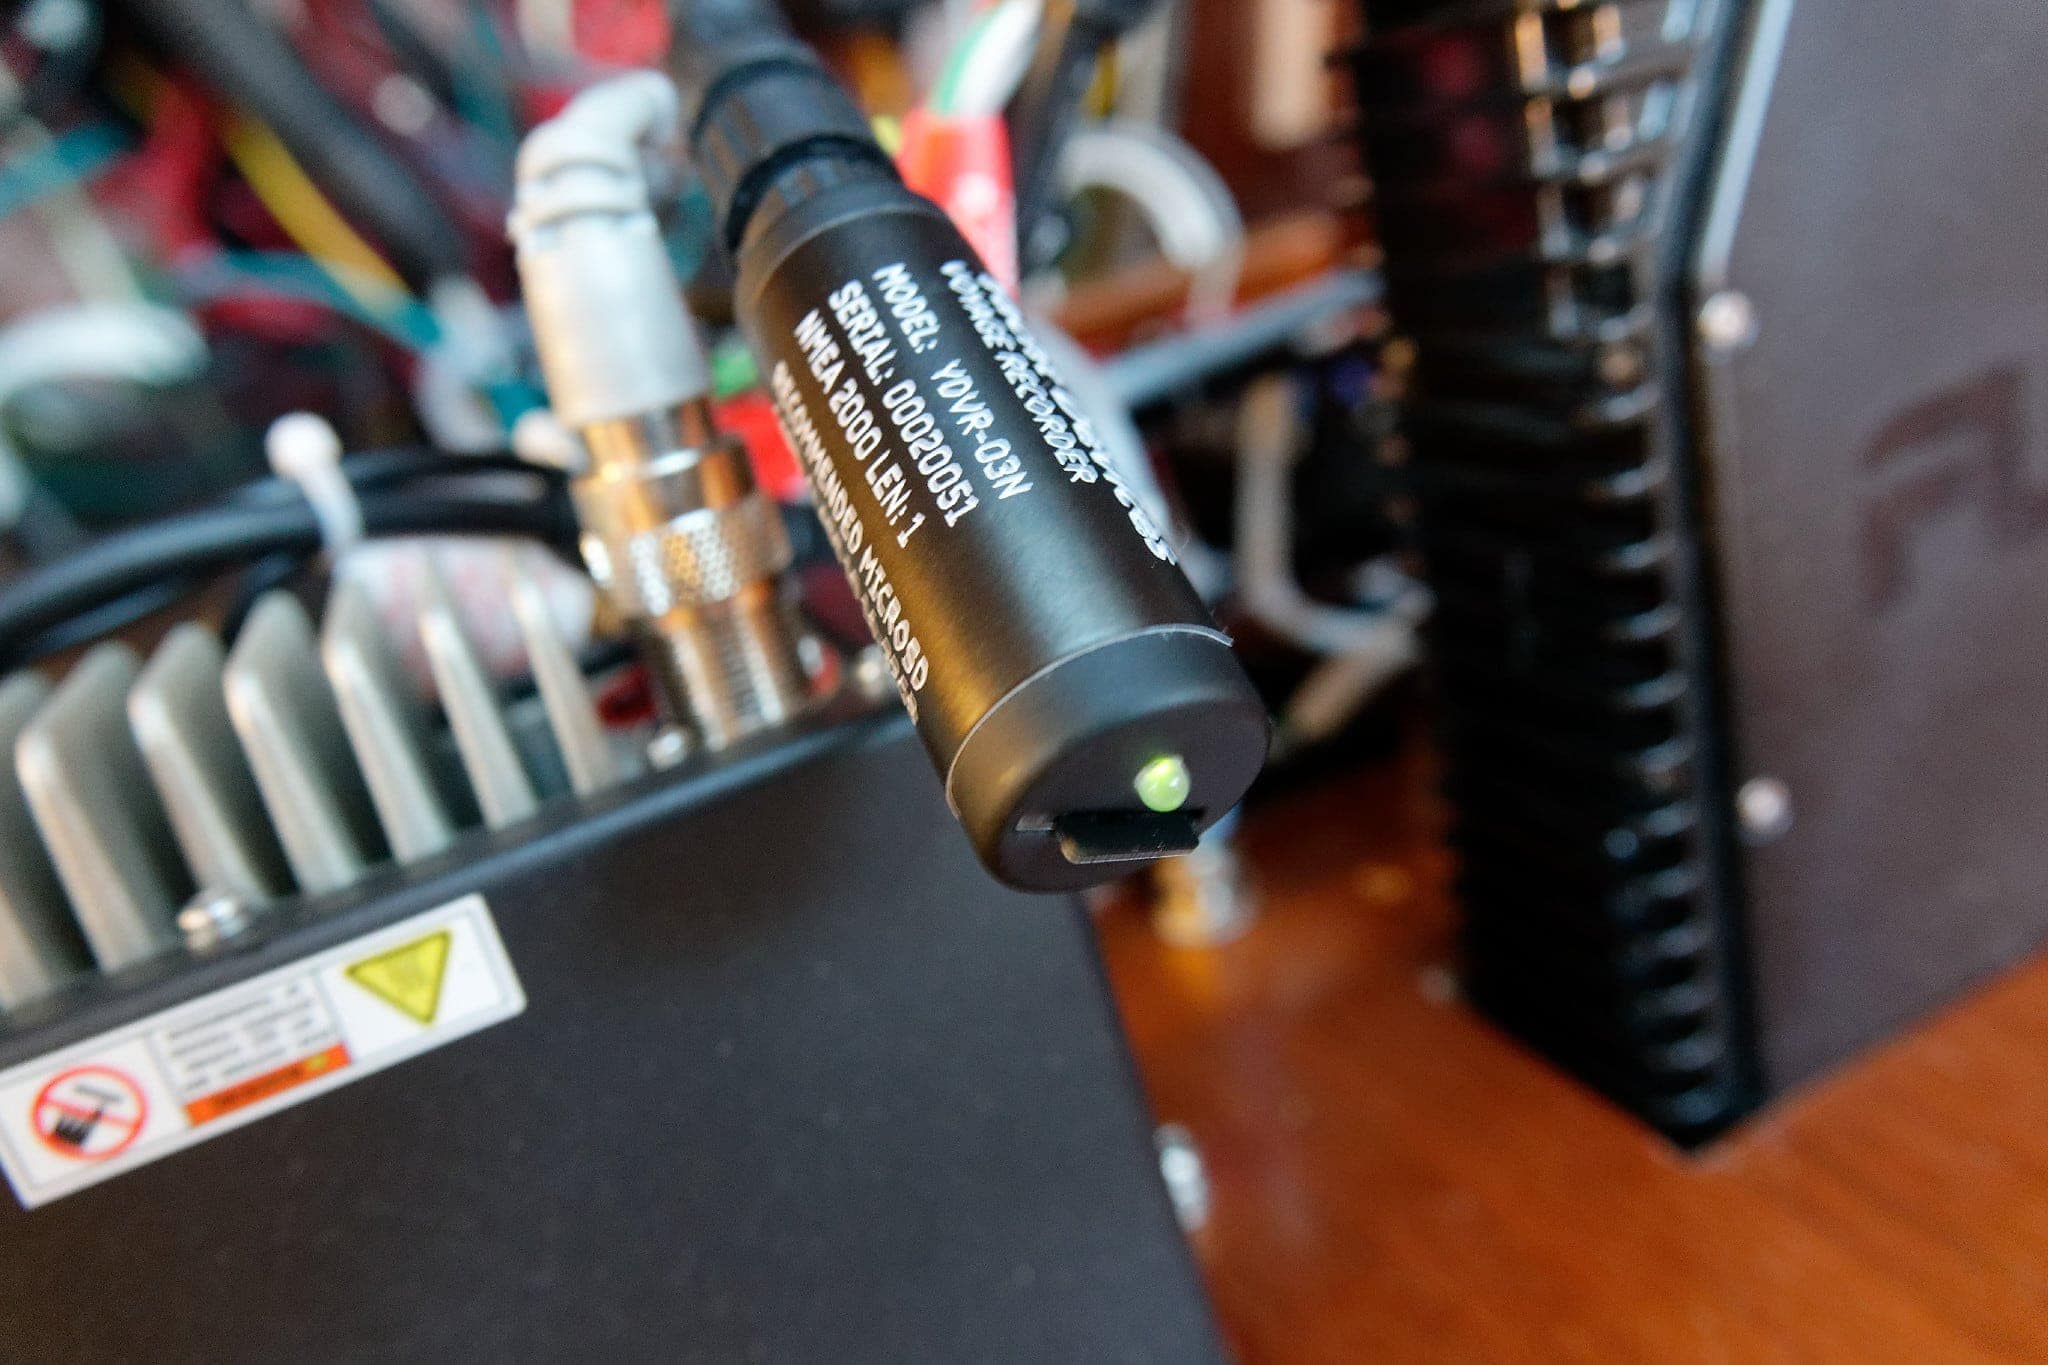
Voyage recorder….recording
Data Gathering
Once you get it connected, there’s really nothing left to do but wait for it to record some data. I left mine connected for about 30 minutes with everything on and active on the network. I wasn’t moving through the water, so things aren’t that interesting, but it did generate about 3.9MB of data.
If we round up to 4MB for every 30 minutes, that would mean I would generate 8MB an hour, or 192MB per day. So that would mean I could record for 166 days before I ran out of space. Oh, and did I mention that the device will auto rotate and keep the freshest data, deleting the oldest?
While I don’t think these numbers will be true when more data is being generated by various devices, if I get even half of that (83 days) that’s pretty amazing. However, I will likely be taking it out after every voyage and using the data to generate maps, analysis, and other things, which brings up a good point…
While I love the size and simplicity of the device, it does not lend itself well to being mounted somewhere where you can get the SD card in and out before and after a journey. I wish there was a mounting bracket or something similar so you could tack it up somewhere behind a bulkhead or in a pocket so you could access the SD card quickly when you know you want to analyze the data.
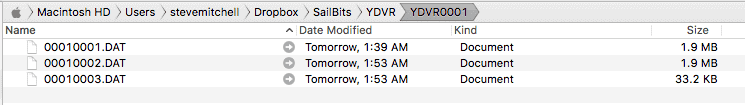
The device records the data in subdirectories named in incrementing numbers, and files named the same way. The way they have chosen to do this is ingenious and takes into account the limits of Windows FAT32 directory and file maximums. It’s clear that a smart engineer not only read the spec for limits like this, but actually did a decent amount of testing and trial and error. I’ve seen many other products for boats and the networking world get this egregiously wrong.
Analysis
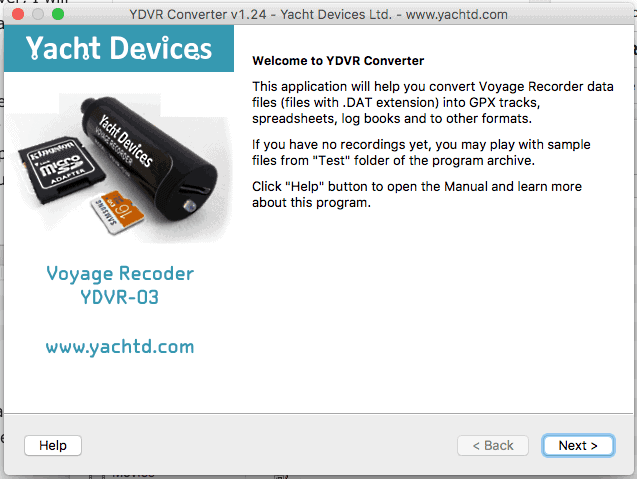
The key to the entire device is the software that gives you the ability to take the files from the SD card and generate various different formats. You download the software from the Yacht Devices Downloads page, and unlike many other manufacturers, the software is available for Windows, Mac and Linux!
I’ve tested the Mac and Windows versions, and I recommend the Mac version over the Windows version. Most Windows machines, including my Surface Book 4, use DPI or screen scaling, and their software seems to have major issues dealing with the scaling. Check boxes were completely un-clickable, text required making the generated window 3-4 times the size to read it, and there were buttons that were missing because of the scaling as well.
The software is super easy to use, and once you have it going, all you do is select a portion or all of the data files generated on the SD card and choose how you want it to be output.
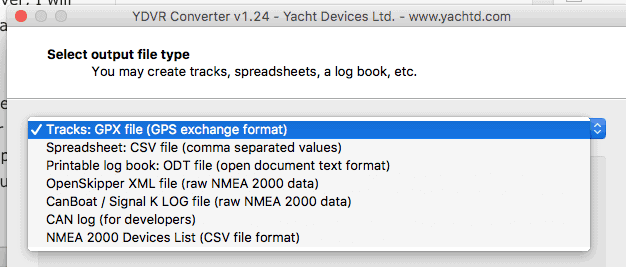
What is awesome about the product is how many output formats you can choose. I personally will be using the GPX, CSV and Printable Log Book formats. Besides that it supports OpenSkipper XML, CanBoat/SignalK, CAN logs, and a list of devices on the network.
GPX options
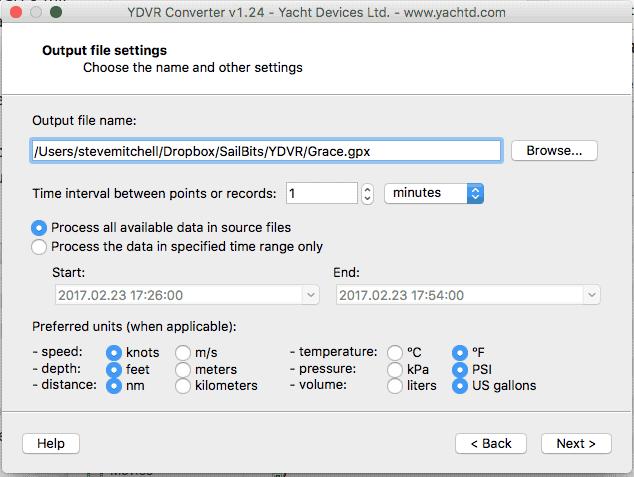
Once you have chosen a format, you get varying options depending on the type of data you’re generating. For GPX, you can choose the time ranges, frequency, and then the units you want things converted into, which is so nice. Many other tools I’ve used simply dump the raw data for everything, and then you’re required to do esoteric conversions for various weird things.
The “time interval between points or records” is useful too – choosing a lower granularity, 1 minute or 1 hour as an example, will result in the software doing min/max/average calculations for you on various bits of data. More on that below.
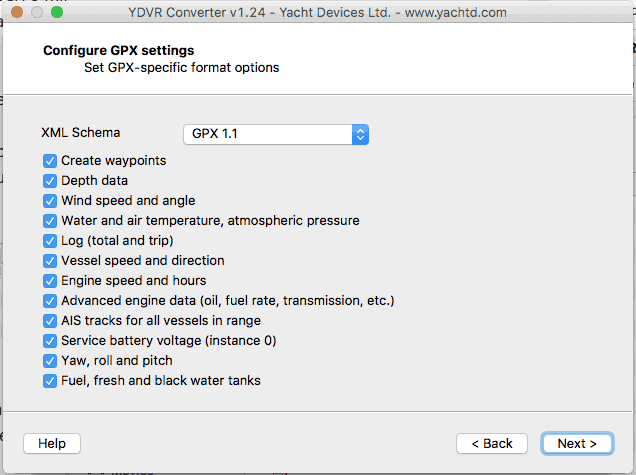
Yacht Devices takes it one step further and allows you to choose the data to convert, which is even more powerful. Instead of generating a file full of engine speed and hours when you don’t need it, you can de-select that data type, and it’s not put in the resultant output file.
There’s a PDF that Yacht Devices have created showing how to take the resultant CSV data and generate a wind rose. There’s also an example of how to create a polar diagram based on general data without any special trial runs. I will definitely be doing this later when I have Grace out and about!
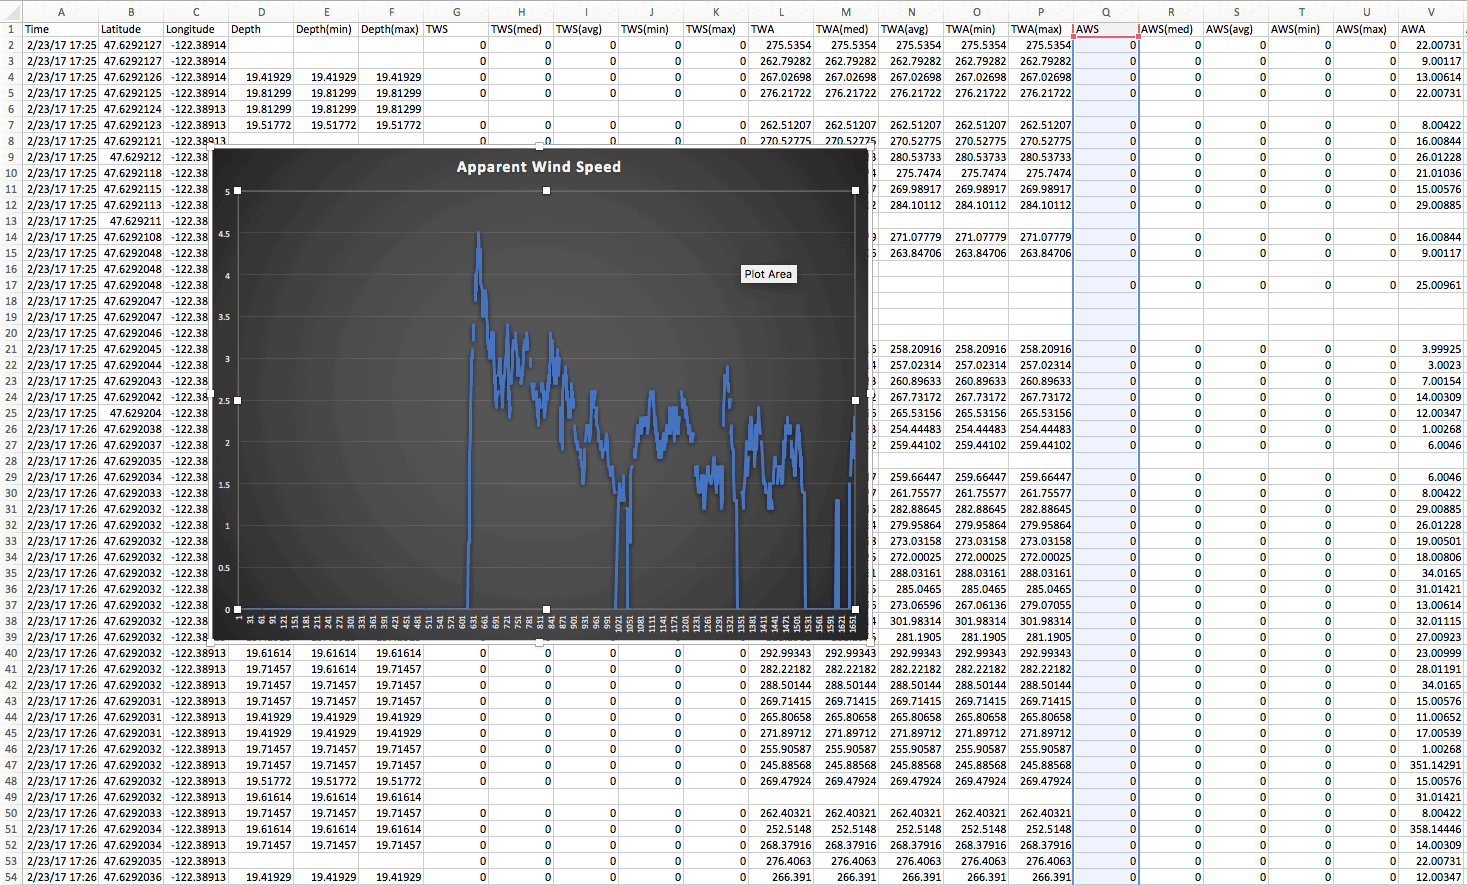
Importing the CSV into Excel, I was able to quickly create graphs of various things like Apparent Wind Speed and the like, and can see the power in being able to create comparison tables, pivot tables, and graphs of various things throughout a journey. The amount of data recorded is pretty impressive as well. In the CSV I see the following:
- Time
- Lat/Long
- Depth (current/min/max)
- TWS (current/med/avg/min/max)
- TWA (current/med/avg/min/max)
- AWS (current/med/avg/min/max)
- AWA c
- STW (current/min/max)
- Heading (current/min/max)
- COG (current/min/max)
- SOG (current/min/max)
- Water Temp (current/min/max)
- Battery Voltage (current/min/max)
- Log
- Yaw (current/med/avg/min/max)
- Pitch (current/med/avg/min/max)
- Roll (current/med/avg/min/max)
- Water Tank (current/min/max)
That’s 64 columns of data! I also see specific columns created for my Water Tank and others, so I suspect if you had more devices, it would create columns for those as well.
What I did notice is that when I selected a time interval of 1 seconds, I ended up with 1659 rows, which is around 27 minutes – exactly the time I had the recorder on. If I selected a resolution of 1 minute I ended up with 27 rows, one for each minute.
I suspect the min/max/med/avg columns are meant to be summarizing the data per their functions based on the resolution of the export – if you only chose to export it on an hour granularity, these columns might matter a lot more.
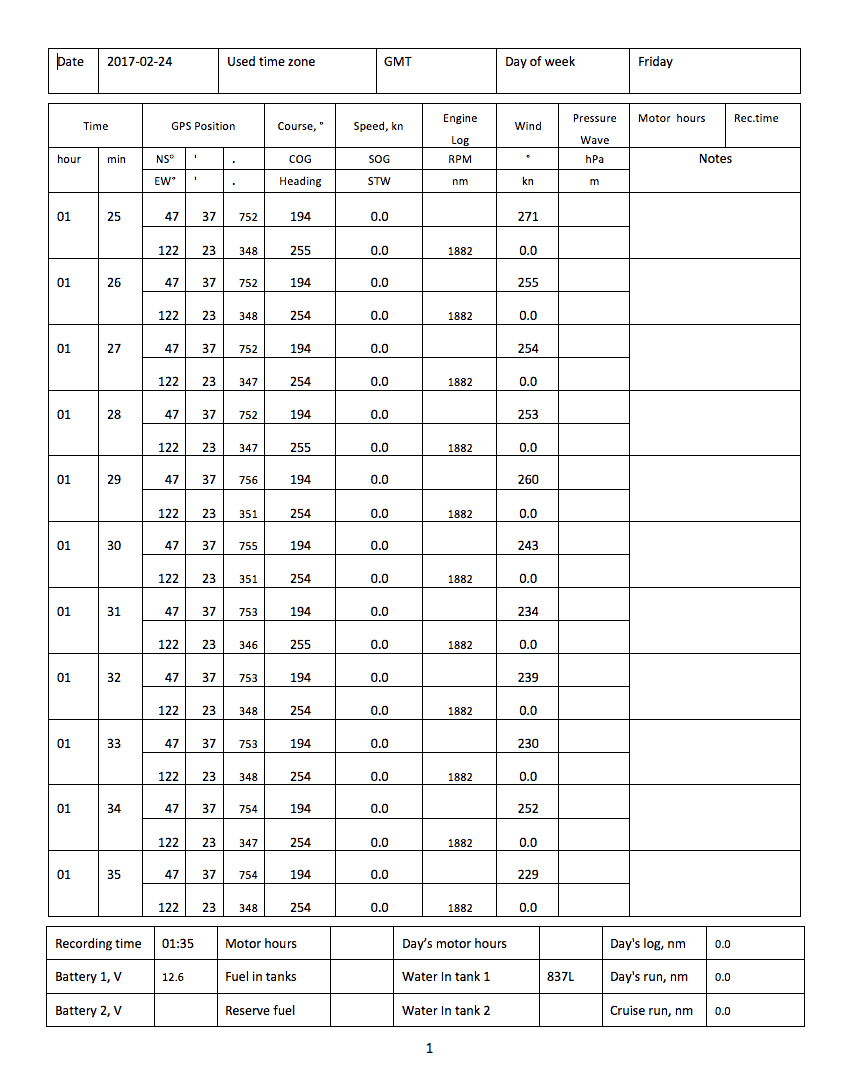
Here’s an example of the logbook output. One could use this with an hour granularity for quite a nice logbook template. It generates an .odt file which you can then open in Word or your editor of choice. I’m not sure where the 837L of water is on Grace – that must be an error!
Competitors
There are a number of other devices out there that record data about the performance and health of your boat, but almost all are combined with other systems or are very narrow in terms of the data they collect. The only other manufacturer that I know of that makes a similar device is Maretron – they have the VDR100 which is very similar.
There are several important differences:
- The Maretron costs $795 vs Yacht Devices $189
- Maretron requires a USB100 or DSM150/250 display to configure it. That’s anywhere from $295-995 of additional equipment to configure it.
- The Maretron has an Ethernet port so you can access data real-time locally and remotely – a nice touch.
- Much less efficient data storage (24GB for 30 days)
- Less export types
Is it worth $811 more to have remote access? Not sure if I would use the remote access feature that much since I’m likely to be pulling data off after a voyage, not remotely to debug a probelm. I’ve used Maretron devices extensively on Grace and even more so on Jammy, and I love how well they are designed, but they are pricey and flakey to configure.
Conclusion
Great, simple hardware with quick install. Cross-compatible software for three operating systems that gives you a ton of different options to export the data – something I have not seen with many other tools. Gathers tons of data and allows you to meld it down to exactly what you want to start analyzing.
Being a stats and data freak, this is the perfect thing to leave running in the background, and then spend hours poring over various details to see how things are performing. I might even consider a cloud database and shoving the data in there all the time for longer term analysis – a pet project of mine for a long time.
The long term results are not in yet, but the Voyage Recorder will get a lot of use this season and will hopefully help me tell stories better on the site by providing track overviews using the GPX data. I can’t wait to start seeing more data and trends, and learning more about Grace in the water!